

Image Source: Pixabay
Gold (XAUUSD) starts the week on uncertain ground as markets brace for major U.S. economic updates. Traders are adjusting their positions ahead of the release of the second-quarter GDP report and the Federal Reserve's policy decision. At the same time, global tensions and inflation fears are adding to gold's appeal. A weaker dollar and rising oil prices offer short-term support. Still, sentiment remains cautious, and the next move depends on upcoming data and geopolitical shifts.
Gold Price Gains Support from Fed Uncertainty and Geopolitical Risks
Gold is gaining support as investors prepare for a pivotal week in the U.S. economy. The second-quarter GDP data and Federal Reserve policy decision are key risk events. Traders are reducing short positions and waiting for more clarity. A temporary pause in the U.S. Dollar's rally has allowed gold to recover slightly. The shift in sentiment reflects caution rather than conviction.
Trade tensions and geopolitical risks are also lifting gold's appeal. Reports suggest that the U.S.-China trade truce may be extended, easing some investor concerns. At the same time, rising oil prices, driven by threats of sanctions on Russia, are stoking inflation fears. Gold is once again acting as a hedge against uncertainty. The metal remains sensitive to any shift in diplomatic talks or energy markets.
However, gold's strength may not last if U.S. data surprises to the upside. A stronger GDP print or hawkish Fed tone could renew Dollar strength. This would likely push gold lower. The fragile rebound in gold shows that bulls remain cautious. The metal is caught between global uncertainty and expectations of U.S. economic resilience.
Gold Approaches Resistance Within Ascending Triangle Pattern
The chart below shows that gold has been trading within a triangle pattern for several months. Since December 2024, the price has formed a series of higher lows. At the same time, it has faced consistent resistance near the $3,500 level. Each breakout attempt has failed, as highlighted by the red arrows on the chart.
(Click on image to enlarge)
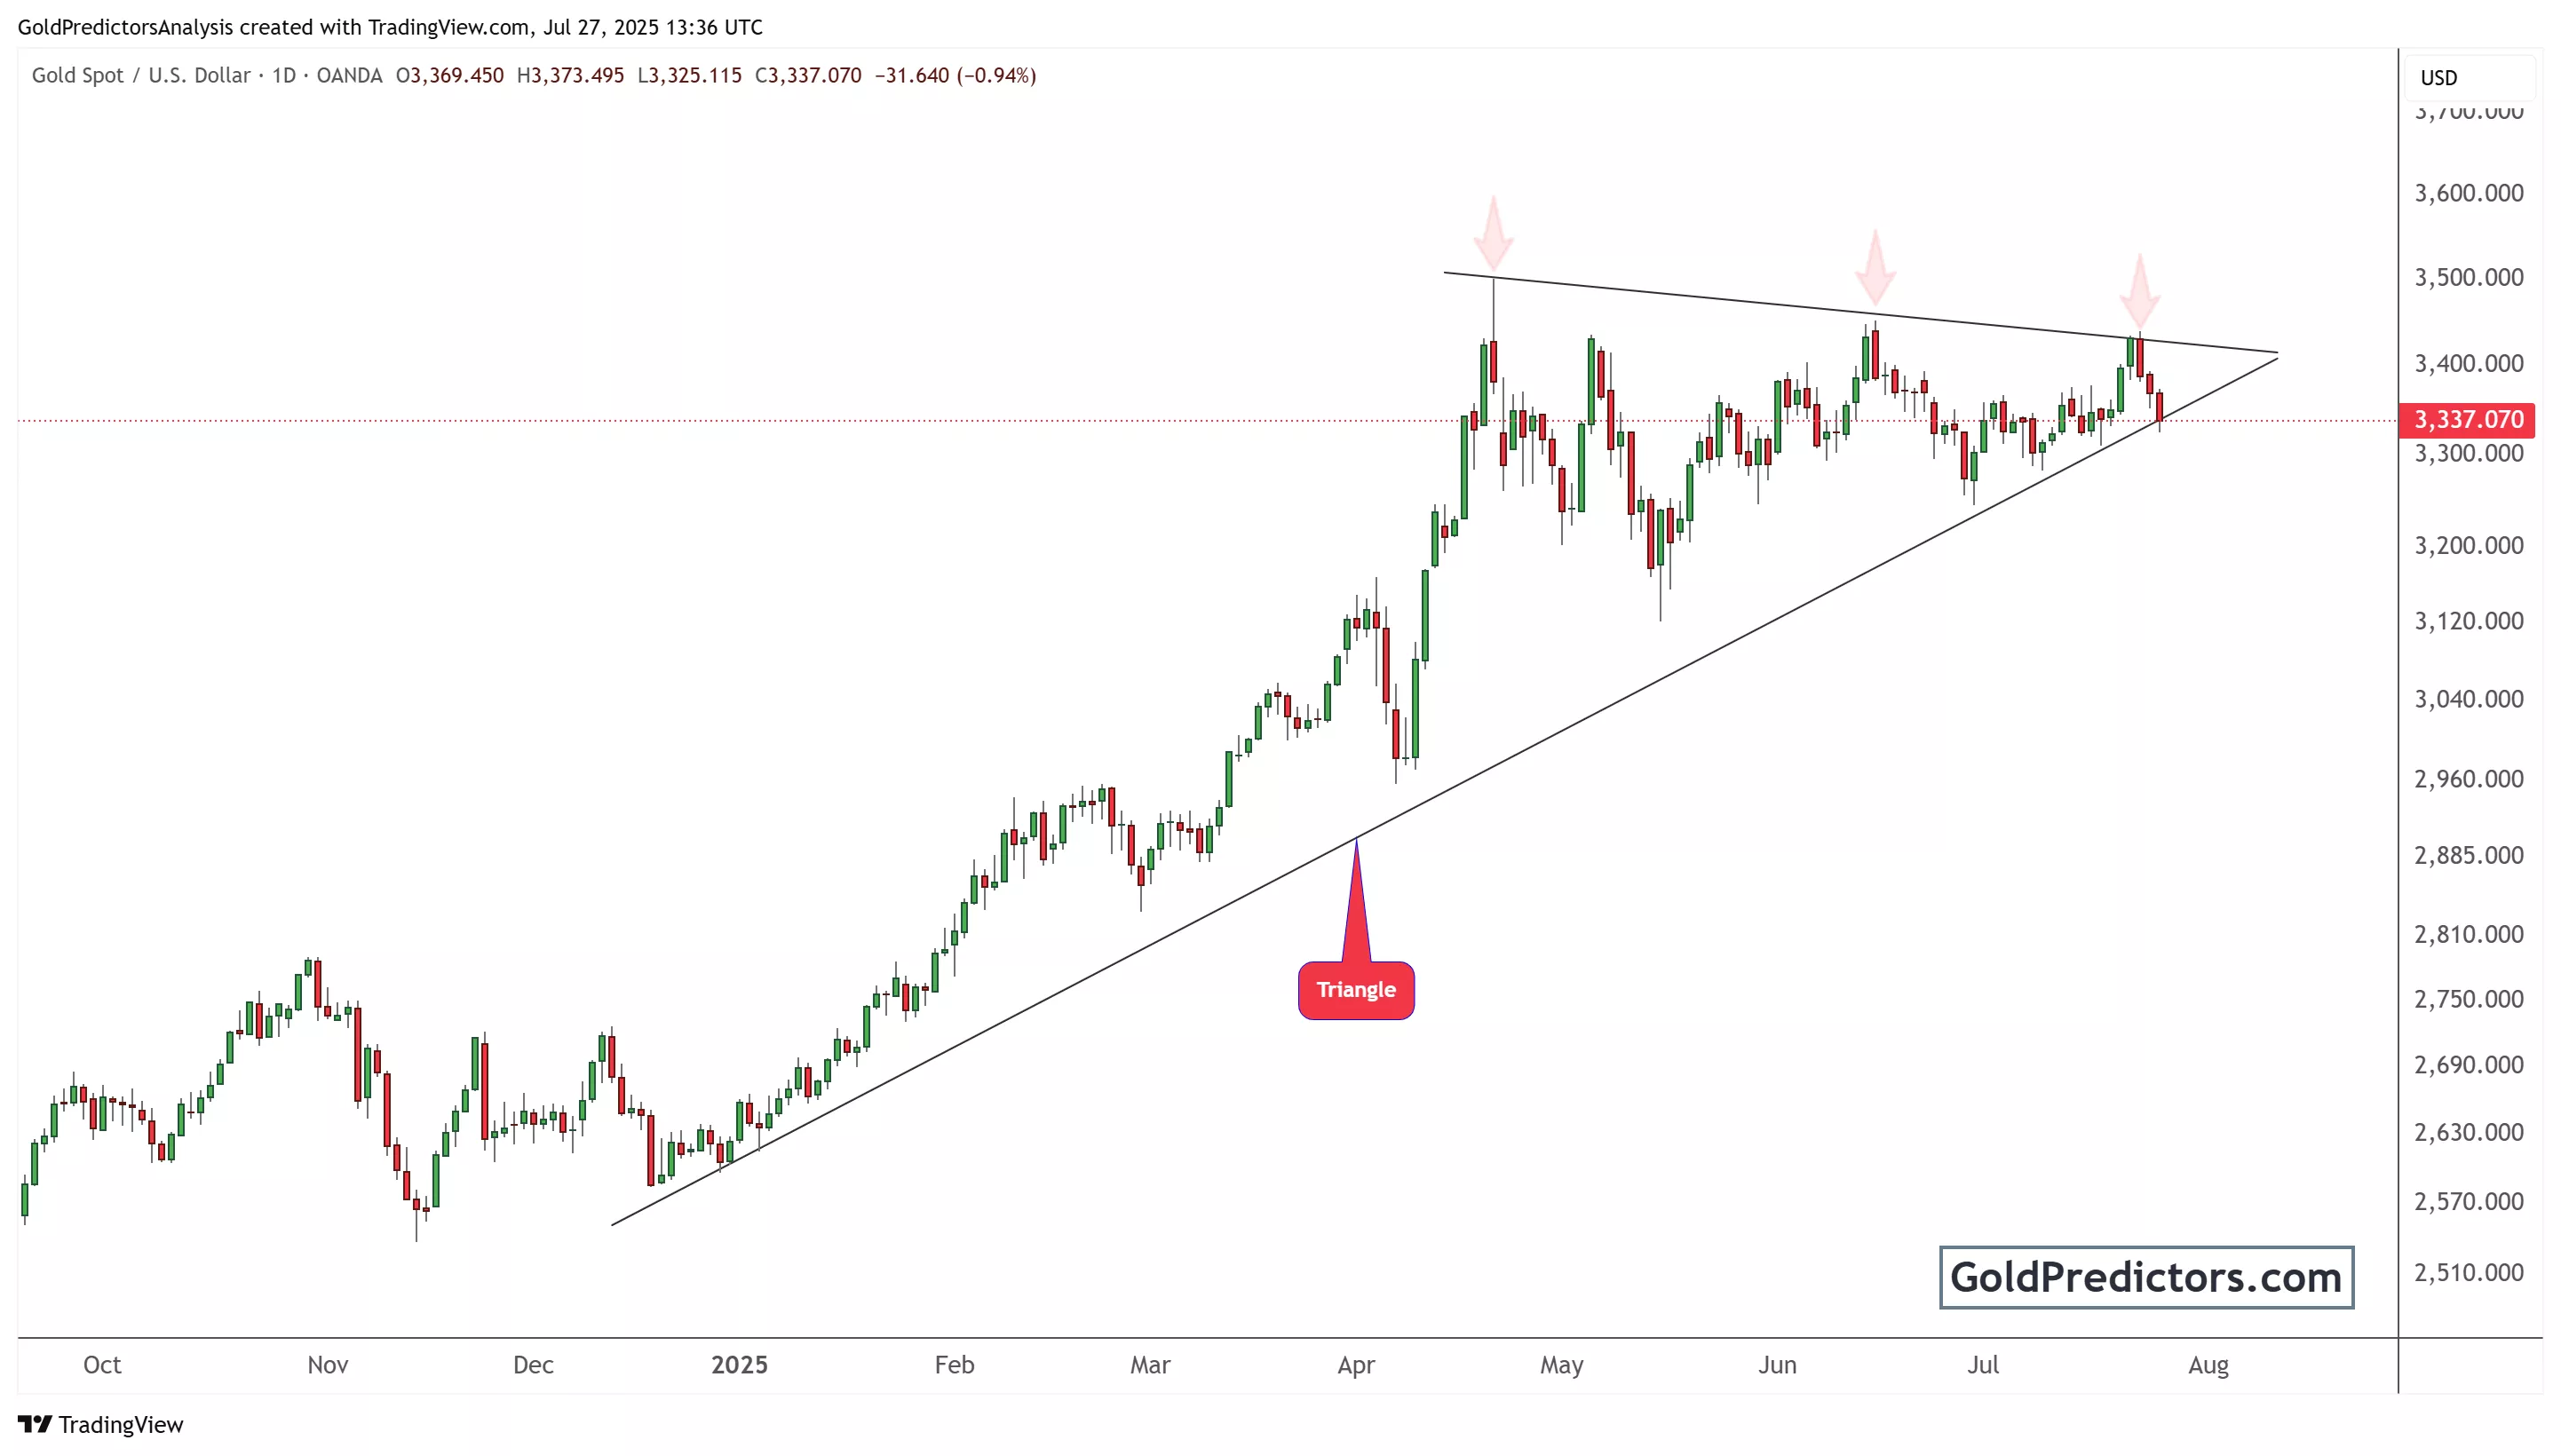
The lower trendline, acting as support, began forming around mid-December. Gold has bounced off this line multiple times, reinforcing its significance. As the price moved between rising support and flat resistance, it created a classic ascending triangle formation. The range has tightened over time, increasing the potential for a breakout.
Last week, gold reached the upper boundary of the triangle again but encountered heavy selling pressure just below the resistance level. This led to a sharp pullback, with prices dropping to around $3,337 on July 27, 2025—just above the support line. Volume has stayed steady, a common feature before a breakout. Traders are watching closely. A break above resistance could trigger substantial gains, while a breakdown may lead to a sharp decline. The pattern suggests a significant move is near, with direction hinging on upcoming news and market sentiment.
Conclusion
Gold is at a critical juncture as traders await key U.S. economic data and Federal Reserve decisions. The ascending triangle pattern signals an imminent breakout, but direction remains uncertain. Easing dollar strength and rising geopolitical risks are currently supporting gold. However, strong U.S. data could quickly reverse that trend. Traders are staying cautious, watching for a decisive move in either direction.
More By This Author:
Gold Prices Dip As Strong US Jobs Data And Trade Optimism Hurt Safe-Haven Demand
Gold Steady On US-Japan Trade Relief, But Fed And EU Concerns Persist
Gold Prices Eye Breakout As U.S.-EU Trade Tensions And Fed Uncertainty Mount


Comments
Log in or sign up to join the conversation.