

Image Source: Pixabay
Precious Metals have been strong this month and have metalheads excited for next year.
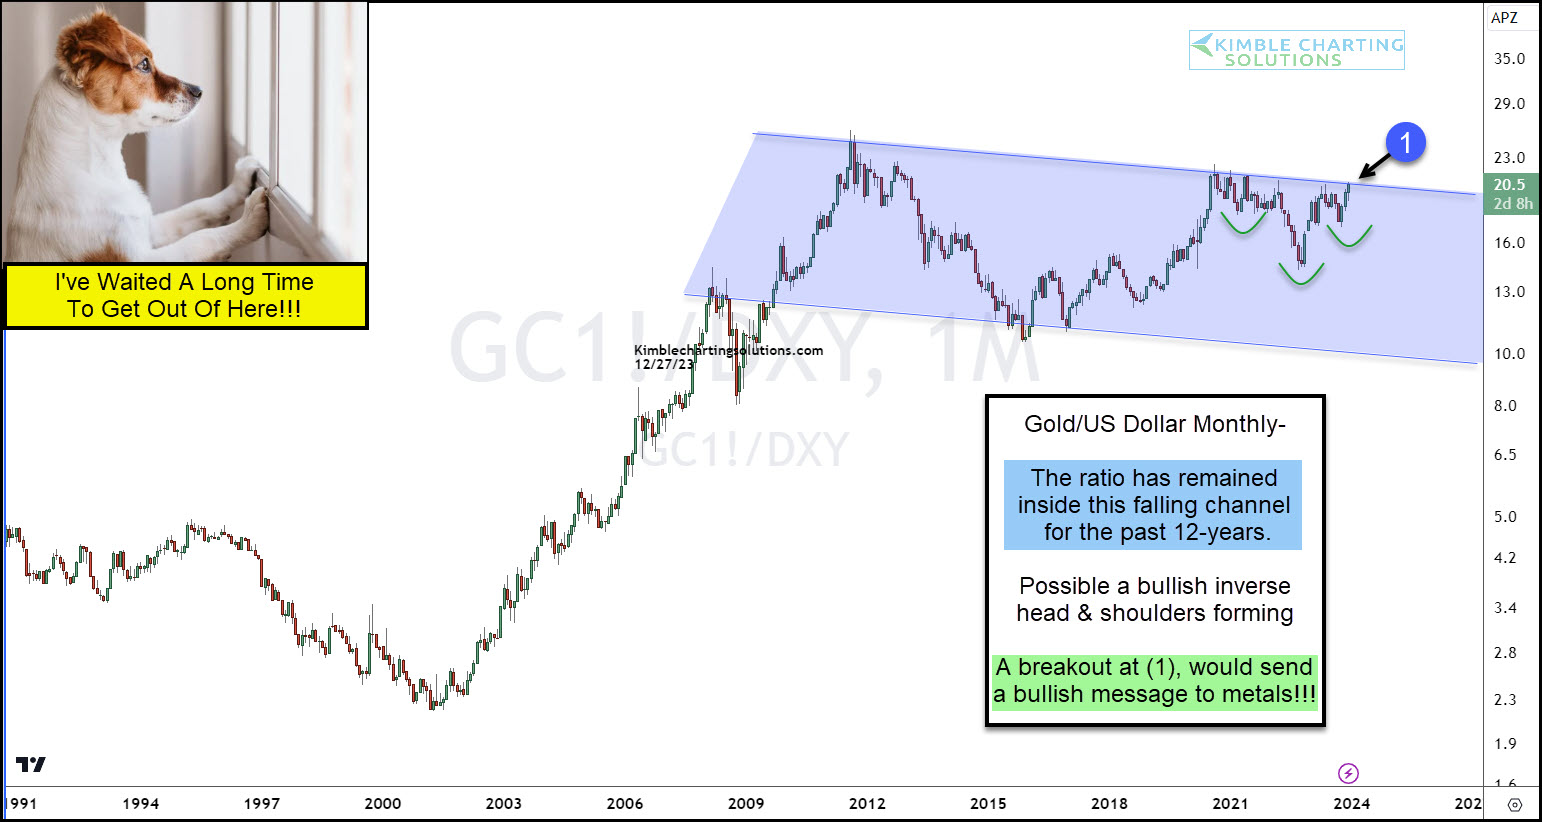
One gauge that I use to highlight the strength of Gold is the ratio of the price of an ounce of Gold to the US Dollar Index. And today’s chart shows why we could be at a critical trading point.
Above is a “monthly” chart of Gold vs the US Dollar ratio.
As you can see, the Gold/US Dollar ratio remains inside the long-term falling channel. Perhaps a giant flag.
The ratio is testing the upper end of this falling channel at (1).
If/When the ratio breaks out, it will send a very strong positive message to the precious metals complex and investors.
(Click on image to enlarge)
More By This Author:
Are Bond Yields Facing Historic Overbought Correction?
Falling Interest Rates Is Historically Bullish For Precious Metals
Semiconductors Attempting Bullish Cup and Handle Breakout


Comments
Log in or sign up to join the conversation.