

Image Source: Unsplash
As I often point out, technology stocks have been the leader of bull market since 2009. And it’s always a good idea to keep a good eye on leadership.
Within the technology sector, the Semiconductors are an area that is often out-performing. Today, we highlight why active investors should be watching the Semis!
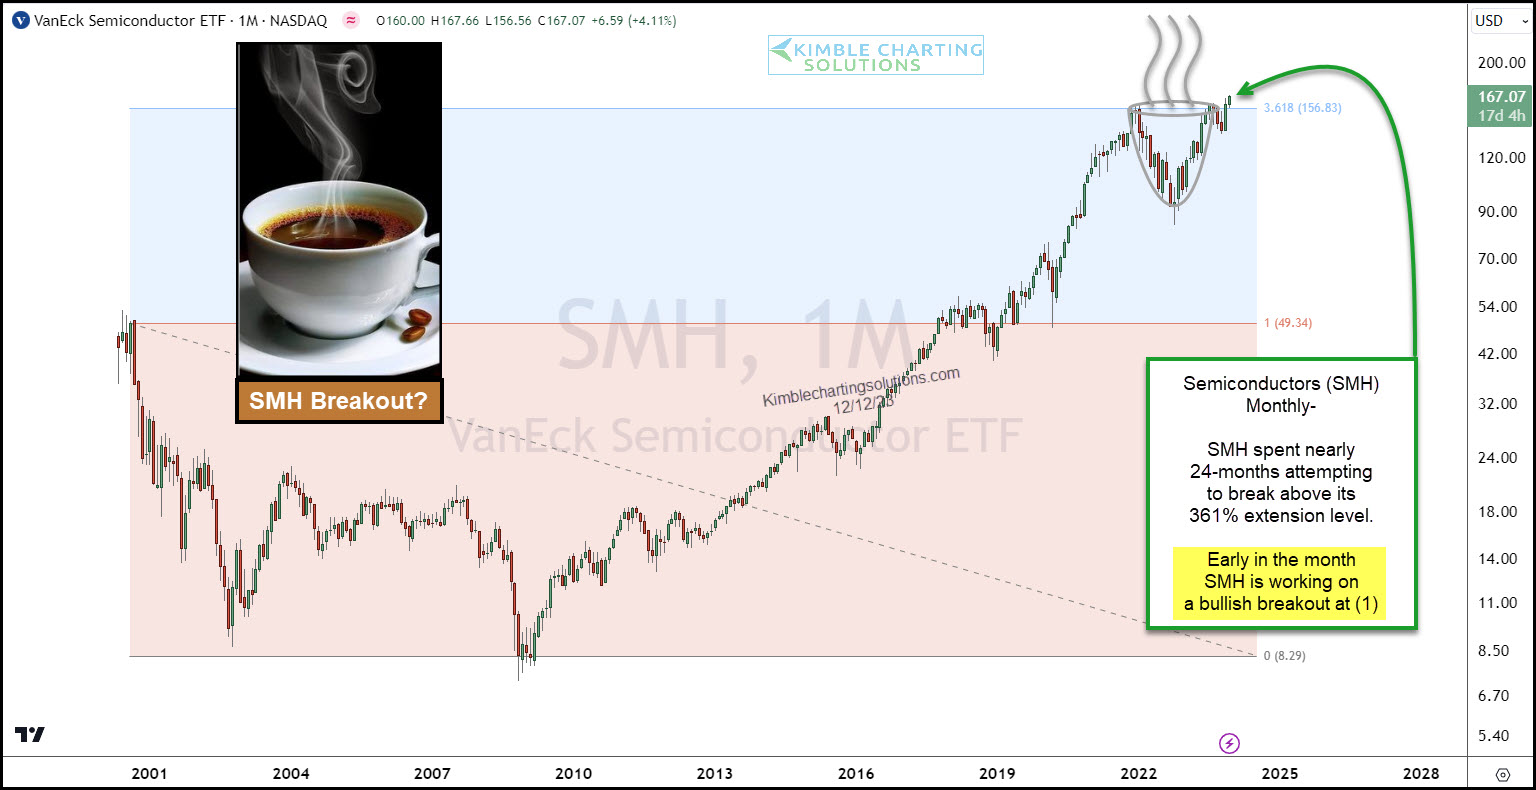
Today’s chart offers a long-term “monthly” view of the Semiconductors Sector ETF SMH.
A few things come to mind. First, the up-trend from left to right since 2009 sticks out. Second, we’ve had a sharp decline and rally over the past two years or so. Third, this price action has created a bullish cup and handle on $SMH right at the 361% Fibonacci extension level. And it’s currently attempting to break out of this bullish price pattern.
It’s still early in the month, so we must be patient to see how $SMH closes. If it closes at or above current levels, it may be in the process of an epic breakout!
(Click on image to enlarge)
More By This Author:
Rare Oversold Signal Could Send Russell 2000 Much HigherIs The Gold/U.S. Dollar Ratio Setting Up For A Major Breakout?
Market Leader Nvidia Struggling At Key Fibonacci Resistance


Comments
Log in or sign up to join the conversation.