
Gold: Extreme Indifference Can Make A Long-Term Cyclical Bottom Unfold
Yesterday morning (July 15) the unemployment claims came out at about 360,000, which was expected, and the 10 Year Note was trading at about 1.31/1.32, down a couple of percent. Gold was trading last at $1825.90, up about a dollar. It was a fairly quiet morning with not much volatility.

Image Source: Pexels
The market is still digesting the CPI news and the PPI, which indicates that inflation is running above expectations. The big question is whether this inflation is going to be temporary, as the Fed suggests, or is it going to be longer term? The 10 Year Note is trying to identify exactly how that will affect the market.
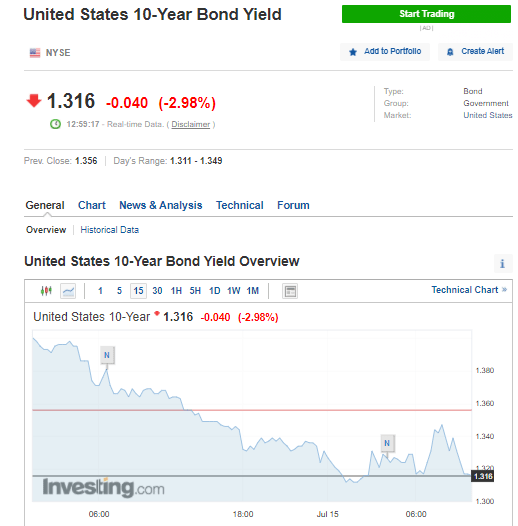
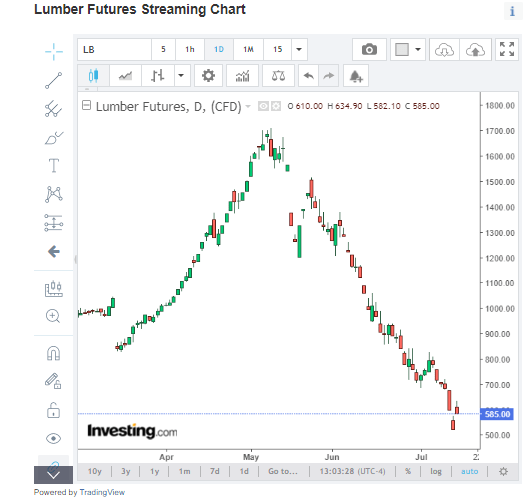
The 10 Year Note is down about 2.98%, which is indicating the opposite of inflation. It is confirming that the inflation numbers could be temporary. We watch the note carefully because if interest rates rise on the 10 Year Note, then inflation could be a problem, which could lead to a problem in the credit markets and a possible credit squeeze. There is great concern that, if interest rates rise, we could be in for a rough time ahead with current debt levels. If the supply chains can meet the tremendous demand that is coming back into the economy, then inflation may not be as bad as some fear. The 10 Year Note shows that most investors believe that inflation is temporary. Lumber, for example, which is a key component of construction, the price has come down to 610.00. We were trading in the 1700s just a short time ago, so we have seen a major collapse in lumber prices. That should, eventually, lead to a decline in the cost of construction and, maybe, the runaway market in real estate.
The 10 Year Note has removed the pressure of price inflation. We are seeing an increase in the PPI, but we are still waiting to see how long this will last. We have a mixed picture right now. We have seen a tremendous amount of equity pumped into the real estate and equity markets. We are also seeing stimulus continuing to come into the market. The Fed’s balance sheet is now more than $8 trillion at a time of record savings. The world is now flooded with cash. The key is how fast this cash will enter the economy, which will determine whether this is inflation for the short or long term. We will have to see if the amount of stimulus is depleting the value of assets valued in dollars, as the dollar declines in value. Since 1971, when we went off the gold standard, we have been exporting inflation, in a way, to the rest of the world. Since then, the dollar has been declining in value. We may be at a point where this stimulus may be jeopardizing the purchasing power of the US dollar - and every other fiat currency. The pressure is going to increase on how we are going to taper off all of this stimulus and then how to pay for the increased level of debt, while maintaining the purchasing power of the US dollar.
Right now we appear to be dealing with a transitory spike in prices due to a bottleneck in the supply chain and increasing shipping costs. We are going to continue to see prices increase, until possibly the end of this year. Then we will see where interest rates are going to go, which will be a key factor in where markets will go. Recently, Chairman Powell was able to cool off the markets, but he might not be able to do it again.
The Metals
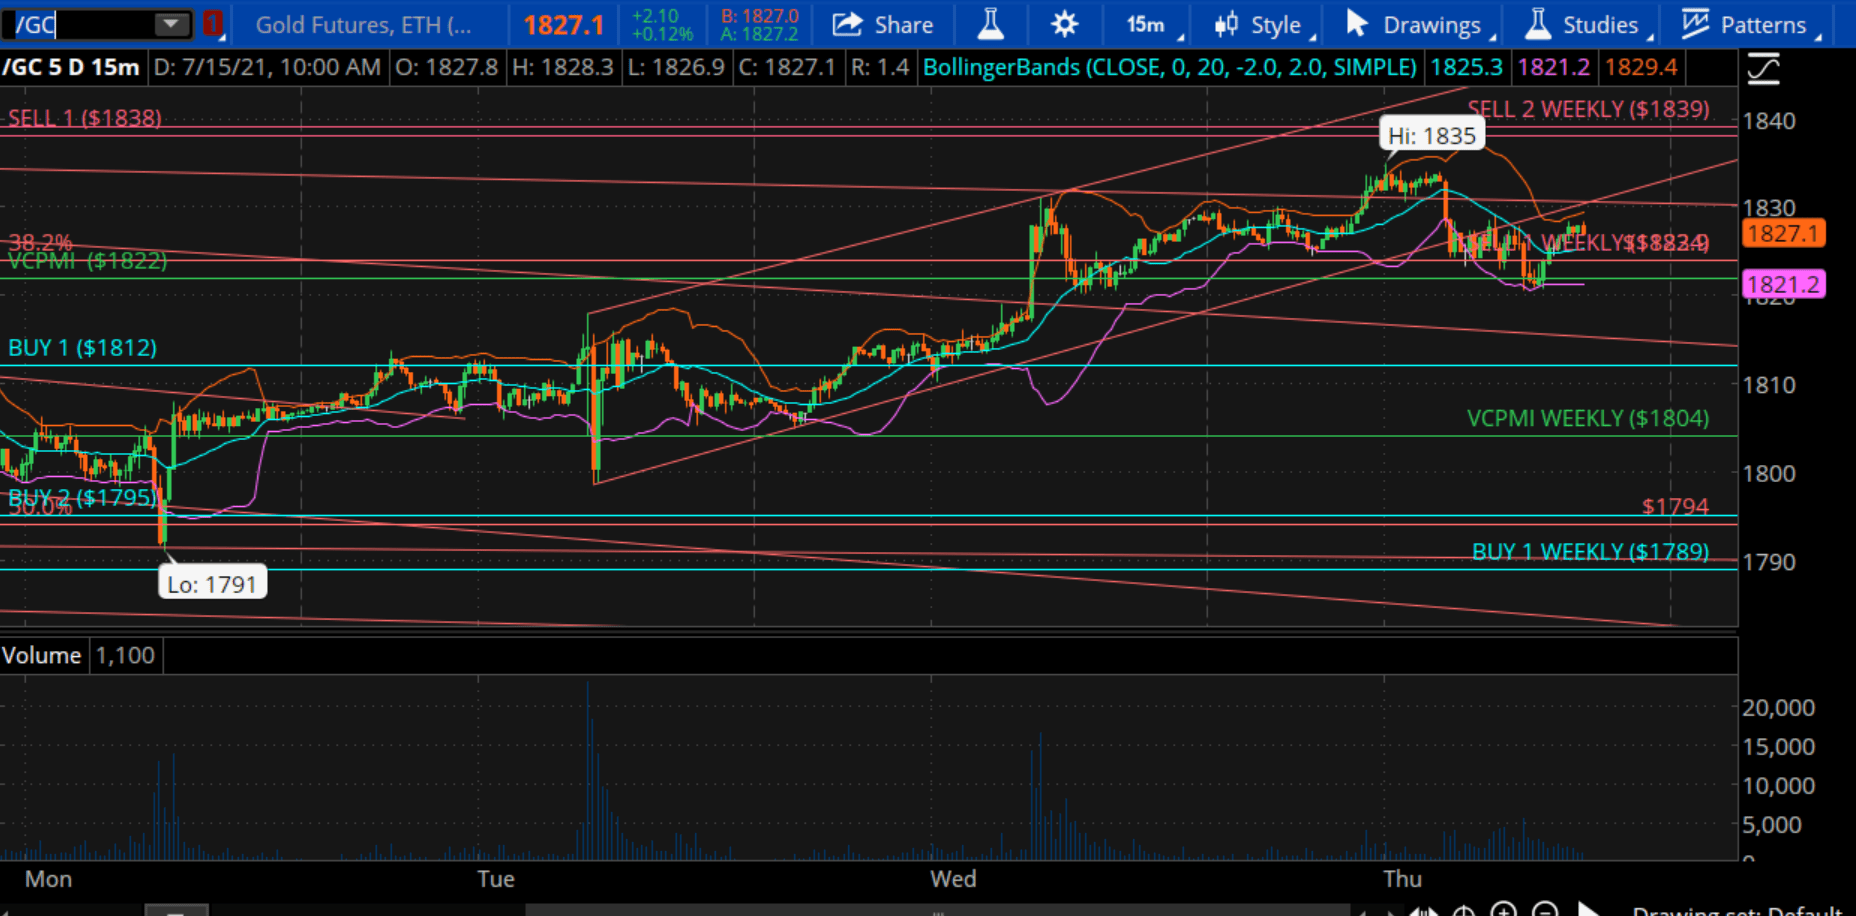
Courtesy: TD Ameritrade
Gold has reverted from a low of about $1791 to $1835 yesterday. We use our proprietary Variable Changing Price Momentum Indicator (VC PMI) to analyze the markets. The VC PMI indicates that at these levels, you should take profits and expect some supply to come into the market, which is what is happening. Gold is now back down into the VC PMI Sell 1 weekly level of $1824. The daily VC PMI average is $1822 and is the next level below. The market trading around that average is a neutral signal. There is a 50/50 chance of the market going up or down. We don’t recommend trading around the average price. The market is trading above that level, so there is a daily bullish price momentum with a VC PMI Sell 1 level above of $1838 as the target. But on the weekly, we are moving into an area of supply and a weekly bearish signal. Therefore, we have a mixed signal. Now we wait for the market to show us where it is likely to move. Either the market is going to close below $1822 and come down to $1812 or we are going to run through $1834 level, the VC PMI weekly, and complete the targets of $1838/$1839. The highest probability for a trade is at the $1839 level, since it is the extreme level above the daily mean and the Sell 2 weekly target of $1839. When the price reaches and goes above the VC PMI Sell 2 level, such as $1791, then that daily signal becomes neutral. Then you want to buy into corrections. Above the Sell 2 level, the market is looking for higher fractals in price.
We would like to see the market rally up to $1839 and revert from there, which would offer a very high probability trade. Right now we have a mixed signal, so it’s a question of how you manage the risk. We wait for the highest probability trades.
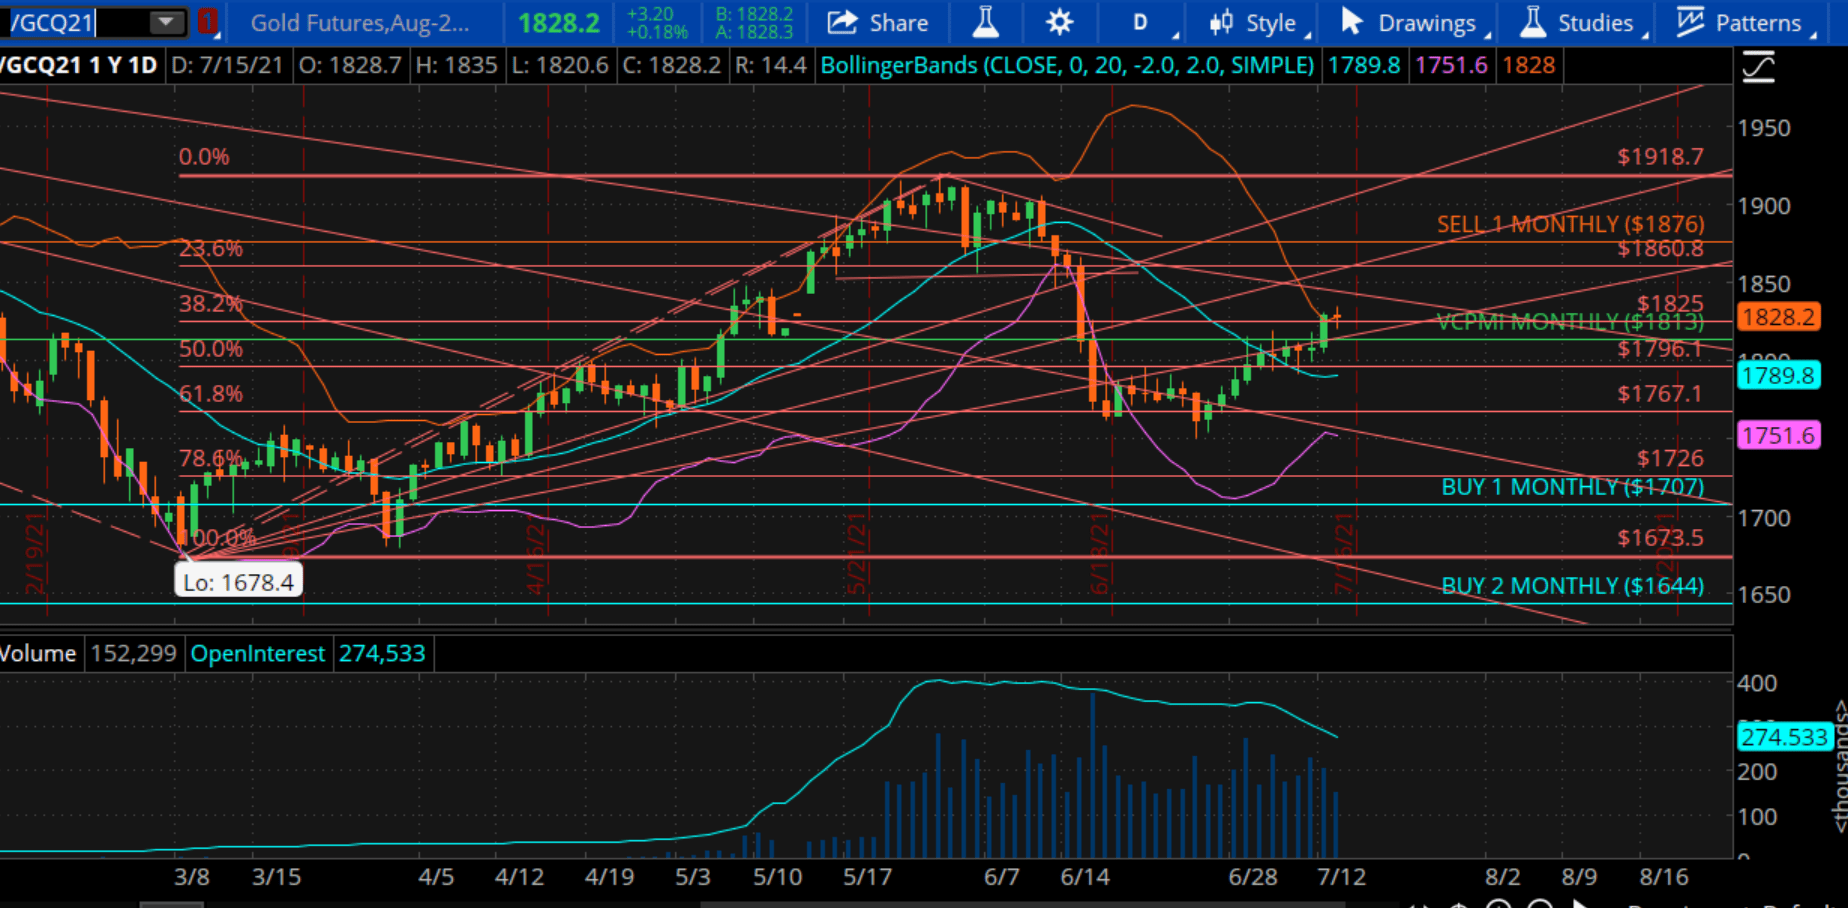
In the bigger picture, we appear to be breaking out to the upside. We are trading above the monthly VC PMI average of $1813. The monthly targets at $1876 to $1982 for the rest of the month. The market is in a monthly bullish price momentum. $1813 is the monthly average price. $1810 is the yearly average price. On the daily, the target is $2150. As long as we close above $1813 or $1810, we are turning the momentum of the daily, weekly, monthly and yearly to a bullish VC PMI price momentum. There is a pretty strong harmonic alignment and we are waiting to see all of the trends moving in that direction. The artificial intelligence of the VC PMI acts like a GPS for your trading and gives you directional advice for the markets, as well as clear levels to enter and exit the market.

We apply the VC PMI to a range of markets to suit your trading needs. It is a flexible, adaptable and proven algorithm for increasing your trading confidence and success.
Disclosure: I/we have a beneficial long position in the shares of GDX either through stock ownership, options, or other derivatives.
To learn more about how the VC PMI works and receive ...
more

