
GDXJ Sinks Again. Should We Close Our Short Position?
More volatility confronted the PMs on Aug. 17, as gold declined by 0.68%, the GDX ETF by 0.79%, and the GDXJ ETF by 0.63%.
In contrast, silver advanced by 0.80%, as the white metal was a relative outperformer.
But rates continued their bullish burst, and the USD Index followed suit. Consequently, the technicals and the fundamentals remain a powerful combination, and little has changed to alter our short and medium-term expectations.
Gold’s Pain Accelerates
It was another drawdown for the gold bulls on Aug. 17, as the rapid rise in interest rates continued. And with the GDXJ ETF closing at a new monthly low, our short position produced even more profits. Although, we’re approaching a point where flipping long offers an attractive risk-reward proposition. And while we’re not quite there, you’ll be the first to know when the decision has been made.
In the meantime, the technicals and fundamentals continue to perform as expected, and our out-of-consensus thesis is now popular among the crowd. To explain, we wrote on Sep. 15, 2022:
We’ve been warning since 2021 that investors materially underestimate the inflation fight that confronts the Fed. Moreover, while consensus expectations continue to move in a hawkish direction, the medium-term economic ramifications are far from priced in.
Please see below:
Bank of America’s latest Global Fund Manager Survey (FMS) shows that most respondents expected the U.S. federal funds rate (FFR) to peak between 3.25% and 3.75% in August (the light blue bars). Conversely, September’s results show that the top spot is now in the 4% to 4.25% range (the dark blue bar).
As a result, what a difference a month makes. Yet, while rate hike expectations have moved materially higher, notice how the 4.5% to 5% and the 5% & above rows are in the major minority? In reality, these are the most likely outcomes.

To that point, while the prediction proved prescient, fund managers are now worried about the dynamics we warned about ~12 months ago.
Please see below:
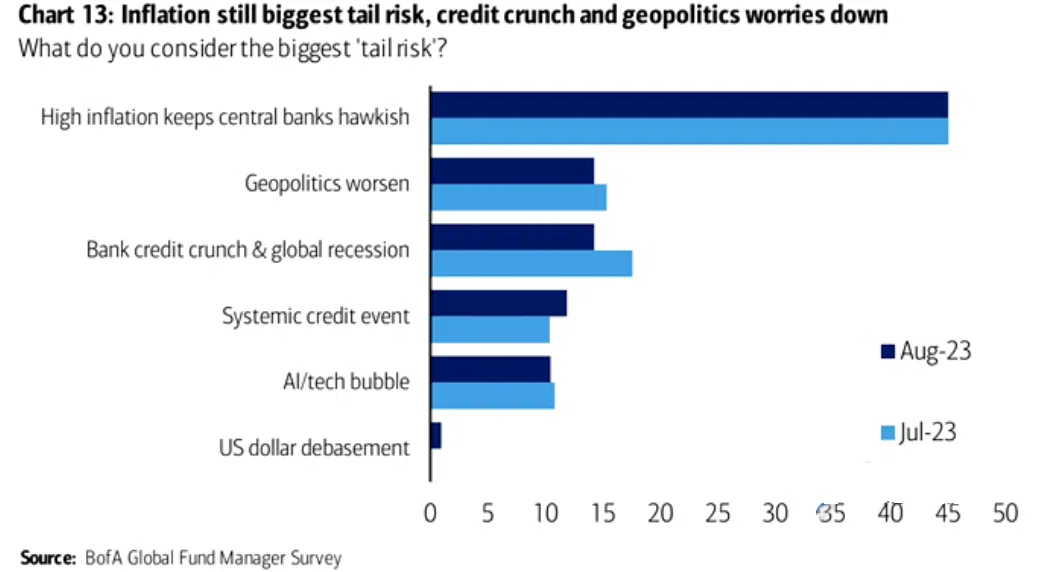
To explain, Bank of America’s latest FMS shows that money managers remain concerned that high inflation will keep central banks hawkish. And while this comes as little surprise to us, assets like mining stocks and silver should underperform in an environment where higher rates reign. Consequently, the recent re-pricings have validated our thesis, and we think a recession will be the final fundamental catalyst that ushers the PMs to their long-term lows.
Speaking of which, The Conference Board released its Leading Economic Index (LEI) on Aug. 17. And with the index declining for “the sixteenth consecutive month in July,” the underlying damage remains. As such, these issues should become material when Americans’ employment prospects and cash balances deteriorate.
Justyna Zabinska-La Monica, Senior Manager of Business Cycle Indicators at The Conference Board, said:
“The leading index continues to suggest that economic activity is likely to decelerate and descend into mild contraction in the months ahead. The Conference Board now forecasts a short and shallow recession in the Q4 2023 to Q1 2024 timespan.”
Please see below:

To explain, the gray line above tracks the year-over-year (YoY) percentage change in U.S. real GDP, while the blue line above tracks the YoY percentage change in The Conference Board’s LEI. If you analyze the right side of the chart, you can see that the blue line remains in recession territory, and this should have profound ramifications over the next six to 12 months.
Dollar Squeeze
The USD Index is back with a vengeance, and the dollar bears have suffered mightily over the last month. And with BofA’s FMS highlighting how bearish bets on the greenback remain, a short squeeze could provide further upside for the dollar basket.
Please see below:
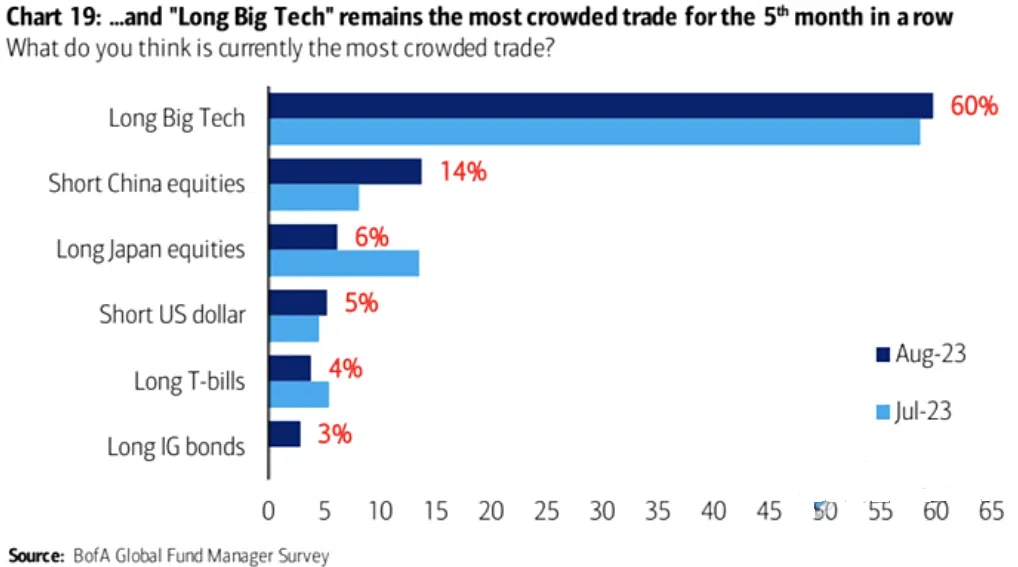
To explain, “short U.S. dollar” came in at fourth on the list of the most crowded trades. And while it’s still much lower than the top two, the dark blue bar shows that short enthusiasm increased from July to August. Therefore, if more of those bets unwind, it could provide more fuel for the USD Index to rally in the latter part of 2023.
Also, noteworthy, crude oil rose on Aug. 17 despite the selling that confronted other risk assets. Thus, even though higher rates and recession fears should hurt economically sensitive securities, oil’s strength makes the situation worse because it stokes further inflation.
Please see below:
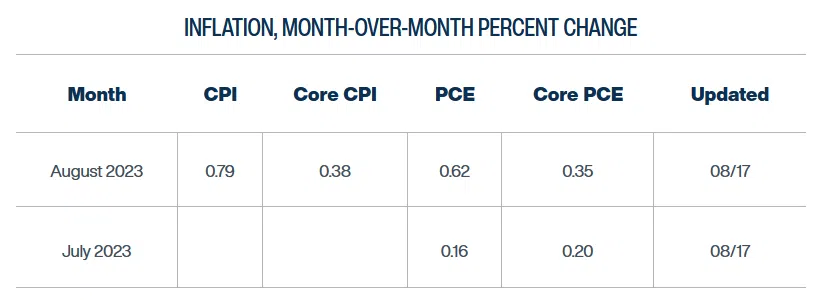
To explain, the Cleveland Fed expects the headline Consumer Price Index (CPI) to increase by 0.79% month-over-month (MoM) in August. For context, this annualizes to 9.90%. And while the figure is abnormally high, the important point is that MoM readings of this magnitude are not conducive to 2% annual inflation. Consequently, the strength is bullish for Fed policy, bullish for the USD Index, and bearish for the PMs.
Overall, the selling continued on Aug. 17, as the S&P 500 suffered another daily drawdown. Yet, the GDXJ ETF’s plight meant even higher returns for our short position. Moreover, while we expect the junior miners’ index to sink to much lower lows over the medium term, an opportunity to flip long is approaching. In other words, asset prices do not move in a straight line, and positioning for a bear market rally could prove immensely profitable in the days/weeks ahead.
Why were fund managers so wrong about inflation and the FFR?
Silver Showcases Relative Strength
Despite the ominous price action that plagued gold, silver ended the Aug. 17 session in the green. It was even more noteworthy since mining stocks were major casualties, which boosted the profits from our GDXJ ETF short position.
So, while we expect a short-term reversal to materialize soon (you will be notified if/when we flip long), it does not change our medium-term outlook. We still think the PMs will take out their 2022 lows, and the development should lead to long-term buying opportunities.
As evidence, we noted how this economic cycle should end with a recession. However, for it to occur, the U.S. labor market needs to weaken materially, and Americans need to spend their cash hoard. And as of right now, that has not happened.
Please see below:
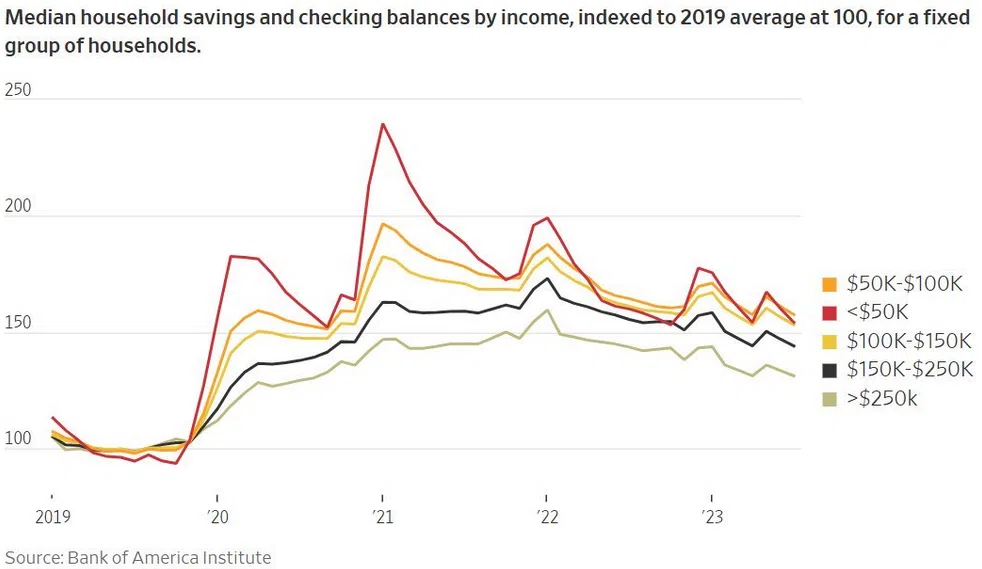
To explain, data from Bank of America shows that Americans’ savings and checking account balances remain above their pre-pandemic baseline. The various lines above organize the data by income, and the 100 level is the baseline for the 2019 average. If you analyze the right side of the chart, you can see that while balances have come down, all cohorts remain in relatively strong shape.
Thus, with Americans’ cash balances still too high to create an economic malaise, the higher rates/hawkish Fed/strong USD Index thesis is still the fundamental bear case for silver.
Manufacturing Musings
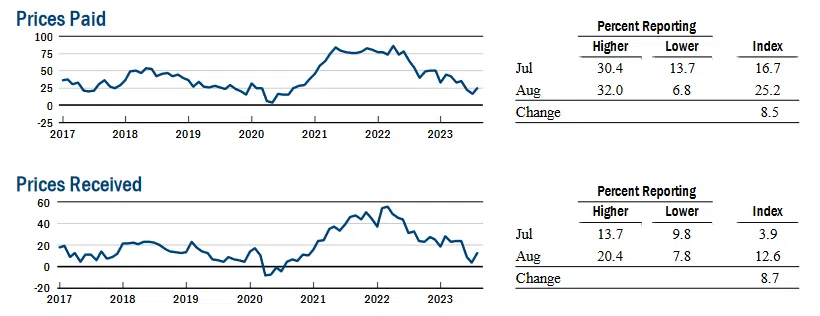
The Philadelphia Fed released its Manufacturing Business Outlook Survey on Aug. 17. The report stated:
“The prices paid diffusion index rose 11 points to 20.8. More than 27 percent of the firms reported increases in input prices, while 6 percent reported decreases; 66 percent reported no change. The current prices received index decreased 9 points to 14.1. More than 27 percent of the firms reported increases in the prices of their own goods, 13 percent reported decreases, and 59 percent reported no change.”
So, while the prices received index decreased, the prices paid index rose materially, which reflects the impact of higher oil prices. And while their expectations fell somewhat, Philadelphia manufacturing firms still see output prices moving well ahead of the Fed’s 2% goal.
Please see below:
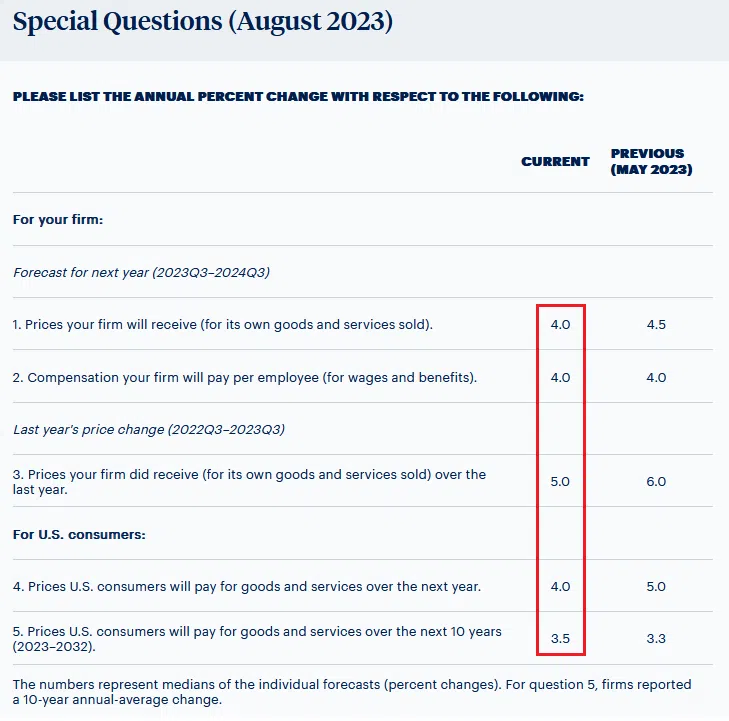
To explain, this month’s “special questions” showed that respondents expect wages and output prices to remain at 4% over the next 12 months. Even over the next 10 years, respondents said 3.5%. As a result, these figures highlight an inflationary psychology that necessities tighter financial conditions and a stronger USD Index.
Similarly, the New York Fed released its Empire Manufacturing Survey on Aug. 16. An excerpt read:
“Both the input and selling price indexes moved up several points, but from relatively low levels, pointing to a modest pickup in the pace of price increases.”
Please see below:
To explain, both metrics are roughly in line with their pre-pandemic figures, so they are less problematic than other data. But, with the pair increasing at a time when CPI base effects have ended, the indicators signal that June should have been the bottom for inflation, and that higher oil prices are filtering through the real economy.
Overall, the GDXJ ETF has declined dramatically over the last month, and the S&P 500 has suffered too. Yet, we still expect more downside, as our take-profit level is steadily approaching. After that, we plan to flip long, as a bear market rally has the potential to generate even greater returns for our subscribers in the weeks ahead. Of course, we will keep you updated with every step of the way to make sure everything is clear.
How high could the FFR go before the U.S. suffers a recession?
The Bottom Line
Financial markets remain unhinged, and we warned that bond volatility is bad for risk assets. When rates incur significant moves, it creates economic uncertainty and valuation imbalances across the stock and commodities markets. And with those imbalances leading to rotations, they spur further volatility. As such, the consequences are playing out in real-time. However, when these issues calm down (they always do), the relative peace should align with our technical timing for buying the GDXJ ETF.
In conclusion, the PMs were mixed on Aug. 17, as silver sidestepped the volatility. Conversely, it’s been a one-way street for the USD Index and the U.S. 10-Year Treasury yield, as their ascents continued. And with the U.S. 10-Year real yield hitting a new cycle high, our expectations have largely come to fruition.
More By This Author:
Miners – Unsurprisingly – Break Below Their June Lows
Preparing For Changes, Profits, And Long Positions In Mining Stocks
Ready for the Next Step? Gold Miners Are.
Disclaimer: All essays, research and information found on the Website represent the analyses and opinions of Mr. Radomski and Sunshine Profits' associates only. As such, it may prove wrong ...
more

