
Expect Congestion For Copper On The Daily Chart In The Short-Term
As I suggested in my post of the 27th October entitled ‘Another false dawn for doctor copper’ pretty much summed up the analysis, the price of copper has once again retraced and arrived back at the VPOC denoted with the yellow dashed line on the daily chart which is now also providing a technical rescue point for the red metal both in terms of volume and price.
(Click on image to enlarge)
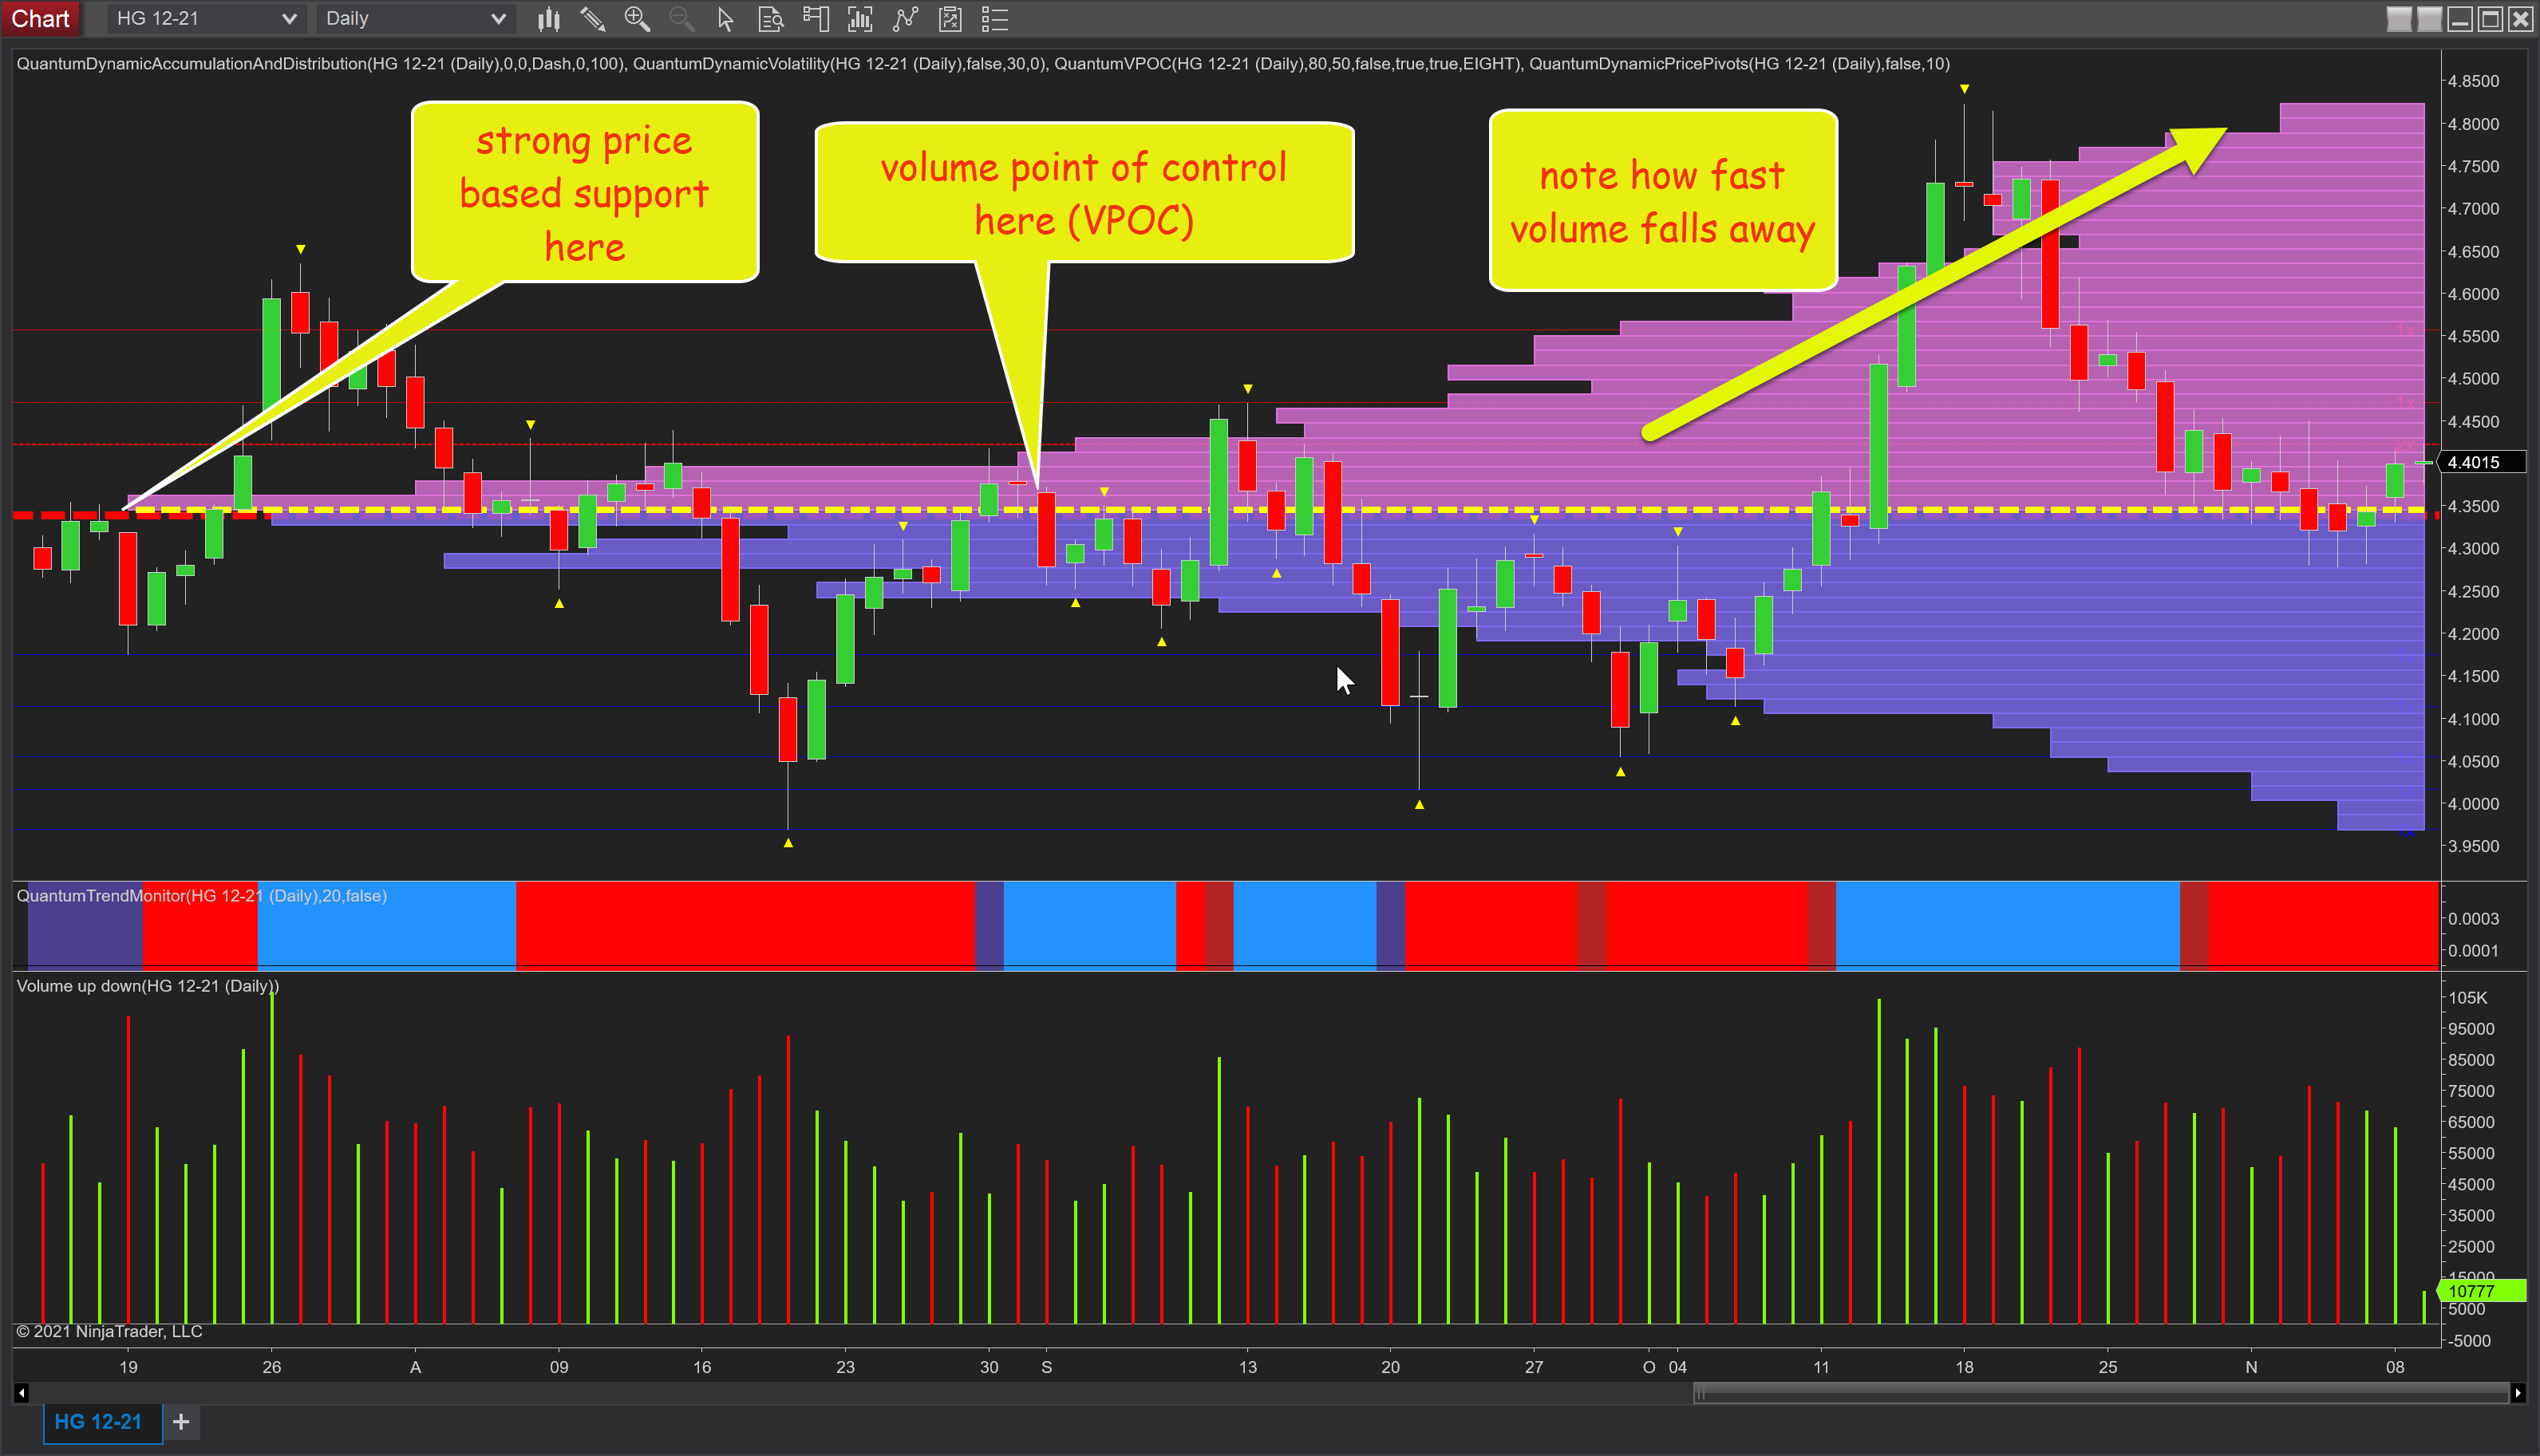
First, we have the VPOC itself and is where we can say we have price agreement to use a market profile term. This is a region at which we have the heaviest volume on the VPOC histogram and hence a point at which we can expect to see further congestion develop in the short term, as indeed we saw last week. Secondly, and immediately below the VPOC we have a very strong platform of price-based support delivered from the accumulation and distribution indicator for NinjaTrader. This is the red dashed line which in combination with the VPOC presents an extremely significant band of support in the $4.35 lbs area. However, the interesting point for the medium term is how rapidly the volume on the VPOC histogram begins to fall away once the price breaks the $4.45 lbs area, and as such we may well see a repeat of the price action of October with a rally through this level with only minor price based resistance ahead at $4.41 lbs.
Disclaimer: Futures, stocks, and spot currency trading have large potential rewards, but also large potential risk. You must be aware of the risks and be willing to accept them in order to invest in ...
more

