
Another False Dawn For Doctor Copper
(Click on image to enlarge)
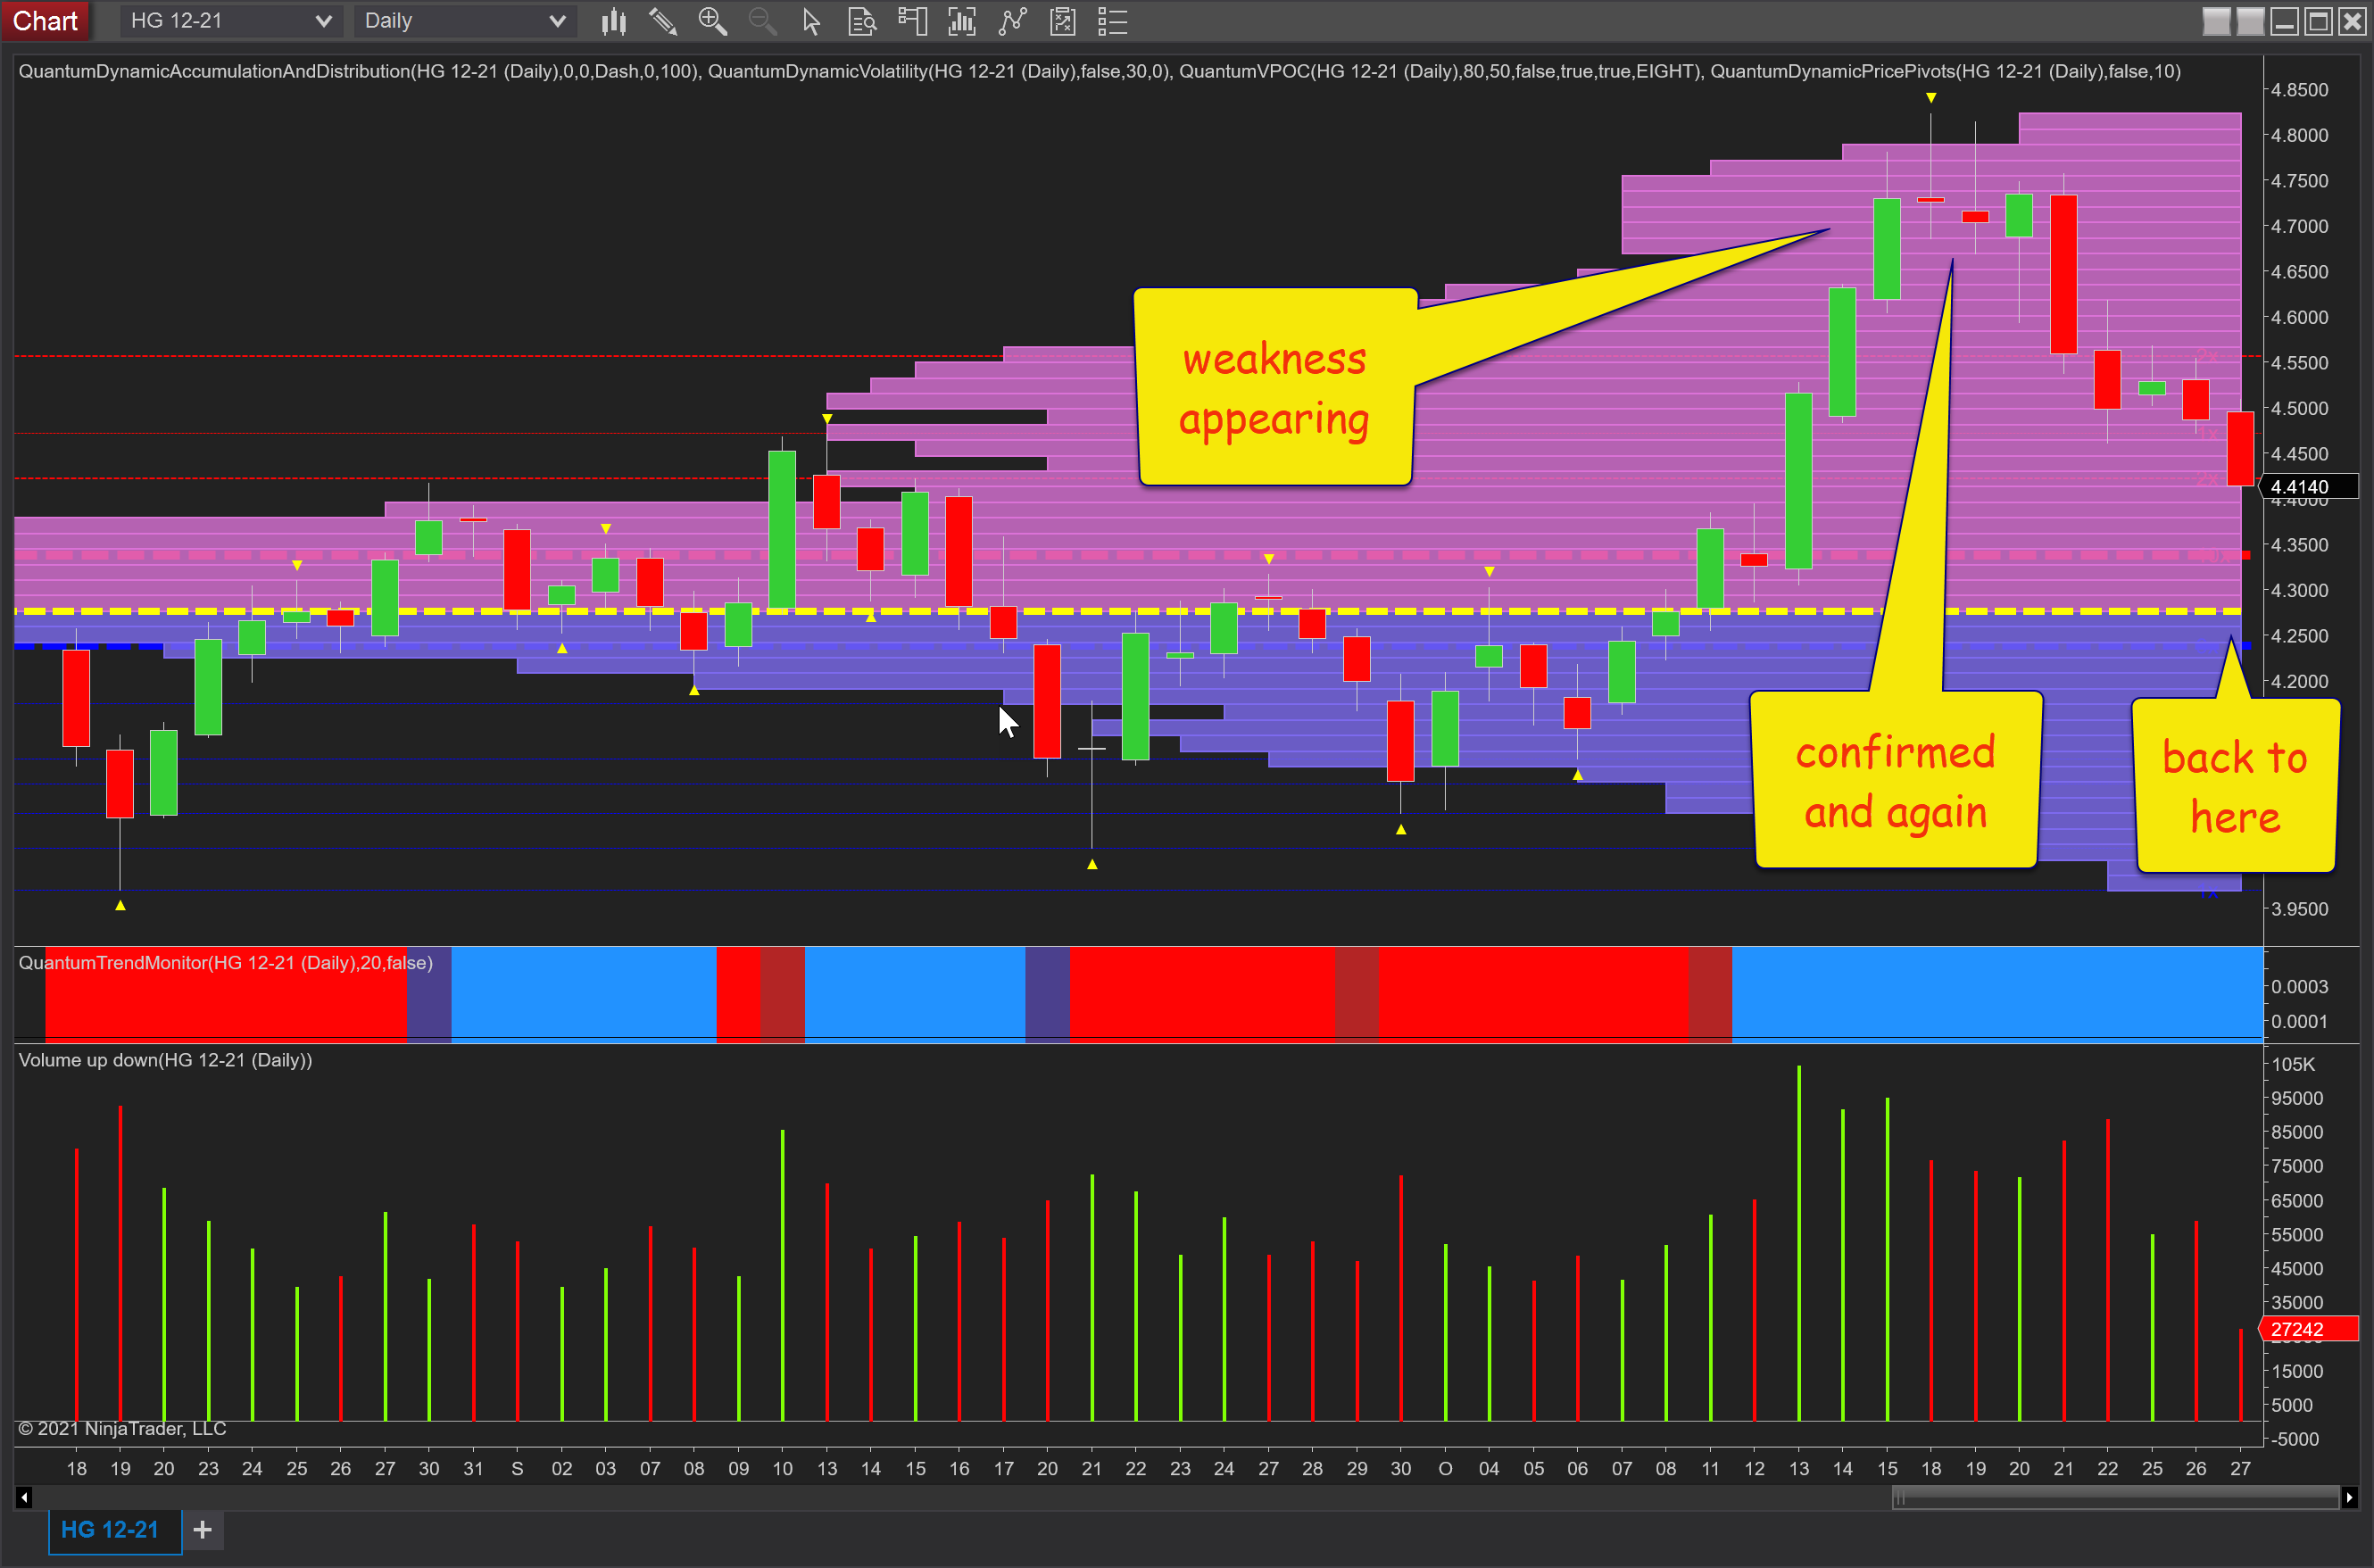
It’s been another false dawn for copper which continues to remain waterlogged restricted to trading in a narrow range as each rally falters and weakens before reversing on the daily chart, a pattern we have seen repeated since May with the volume point of control remaining the focus.
The breakaway from the VPOC promised much with both the candles and volume of the 13th October and 14th October looking bullish. Here we had wide spread up candles on excellent volume with no wicks to top or bottom. The price action of the 15th October then followed on equally strong volume but with a wick to the upper body suggesting some short-term weakness. The following day this was confirmed with the well-defined shooting star of the 18th of October confirming the prior day’s signal and repeated on the 19th of October with another strong signal of weakness on comparable volume. The price action of the 20th October then hinted at possible support before this was snuffed out the following day with a wide spread down candle associated with good volume. A weak attempt to rally has once again been snuffed out as bearish sentiment drives copper lower with further bearish pressure today as the price moves towards the $4.40 lbs area. So the question now is where next for the price of copper? And the short answer is back to the volume point of control at $4.28 lbs and denoted with the yellow dashed line with a potential pause and support at the price-based level of $4.34 lbs denoted with the red dashed line of the accumulation and distribution indicator.
(Click on image to enlarge)
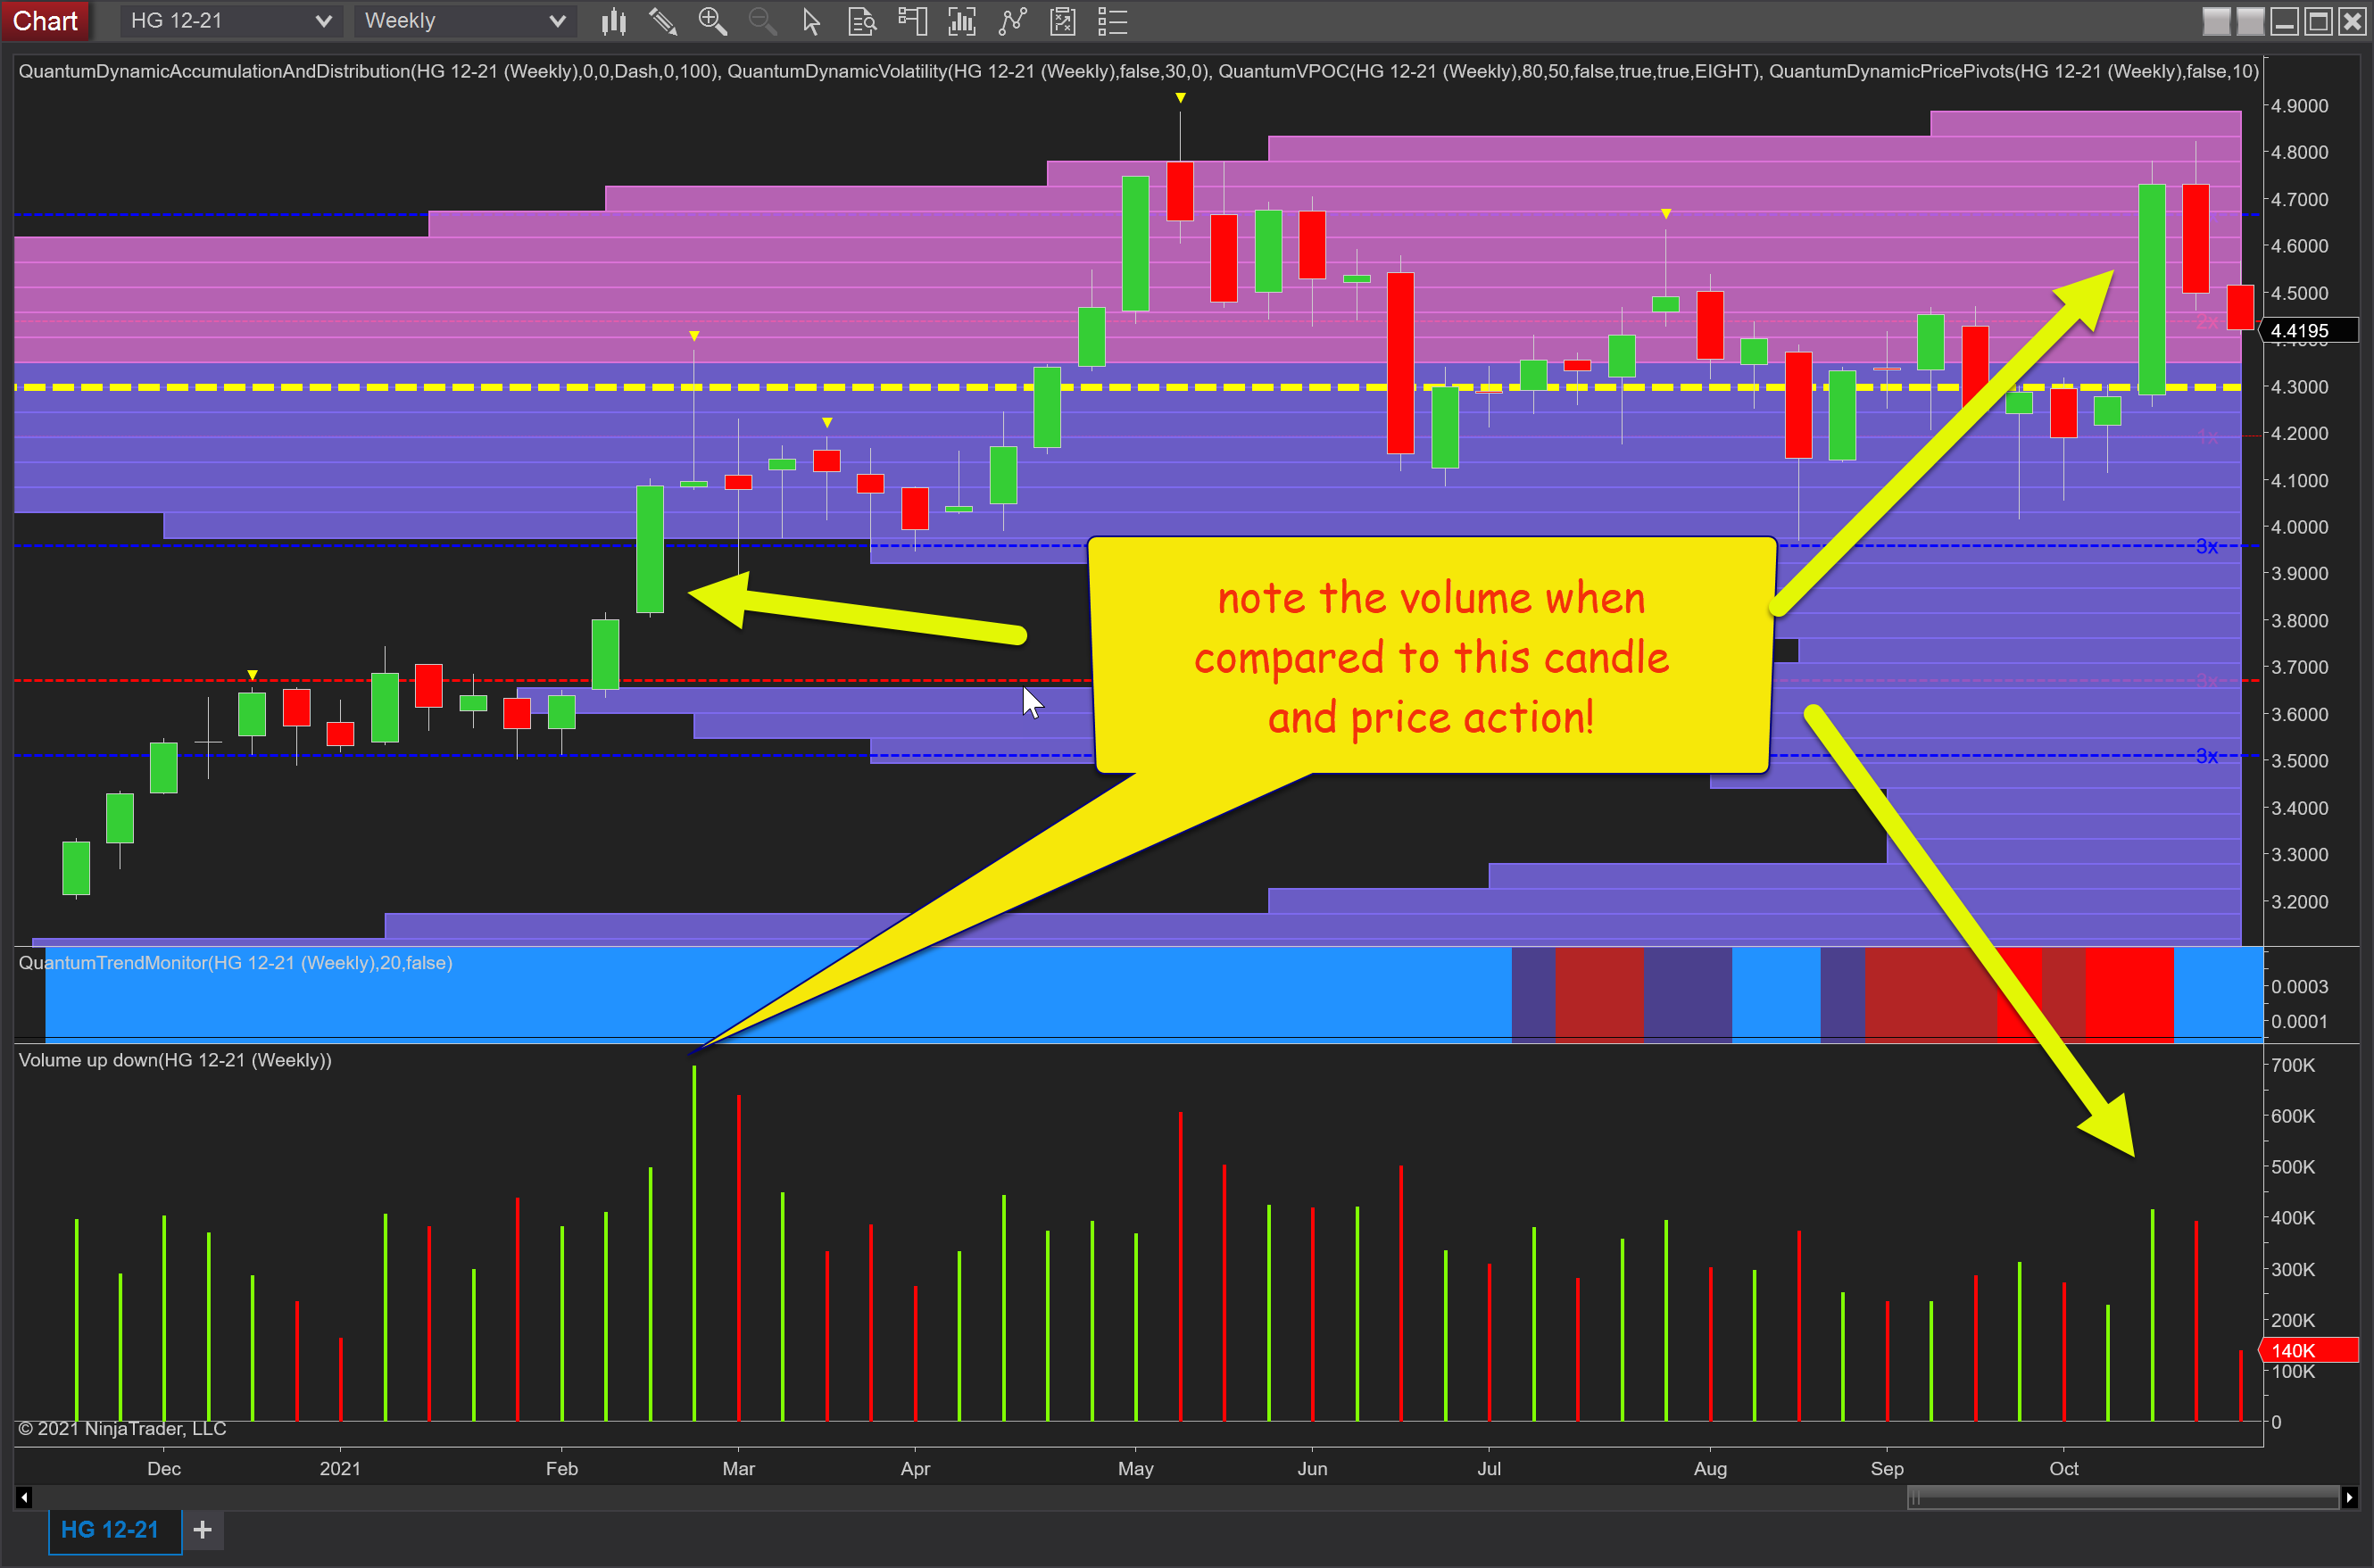
Moving to the weekly chart, this is interesting for a different reason and once again reveals the importance of considering different timeframes in any analysis. And the important candle here is last week’s price action extending from the VPOC at $4.3lbs through to $4.70 lbs and beyond, but look at the volume. Is price and volume in agreement or disagreement? And the short answer is the latter, particularly when we consider the volume associated with the price action of the final week in February. The volume is significantly more, almost double yet the price action is half. This gives us a benchmark to consider and which sends a clear signal that last week’s move is a trap as the big operators are not participating and hence we can expect a reversal in due course which is what we are witnessing now. An example of Wyckoff’s third law in action and this simple analysis confirming what we are now seeing for copper on the daily timeframe.
Disclaimer: Futures, stocks, and spot currency trading have large potential rewards, but also large potential risk. You must be aware of the risks and be willing to accept them in order to invest in ...
more

