
Elliott Wave Technical Analysis: Coffee - Thursday, March 27
Coffee Elliott Wave Analysis
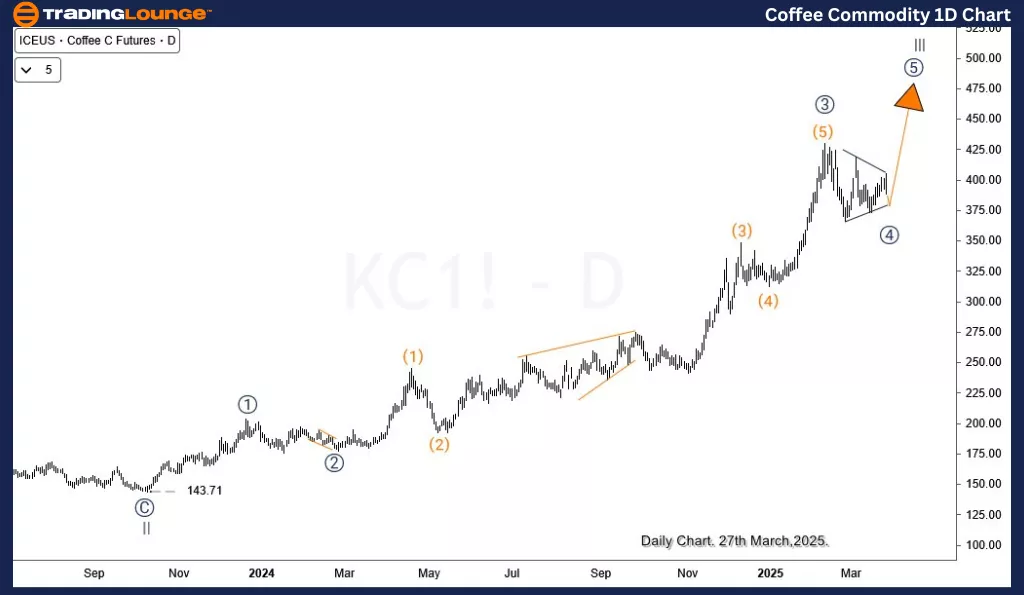
Coffee is stuck within a sideways structure from the February 2025 high. However, the upside path remains intact, and the price should eventually break to the upside. Triangle structures often precede the last leg of a cycle. In this case, the bullish cycle from October 2023 may soon finish after the next rally, giving the path for a deeper pullback.
Coffee Daily Chart Analysis
Price completed wave (II) of the super cycle degree in January 2023. From there, it completed waves I and II of (III) in February 2023 and October 2023 respectively. About 17 months later, this cycle peaked to complete wave ((3)) of III in February 2025 and then started a pullback for ((4)) in what looks clearly like a triangle structure. With this structure, we will expect one more rally to finish III and then a bigger pullback in IV. Provided the price doesn’t break below 373, the triangle structure will remain and will eventually break upside to 480-500.
Coffee H4 Chart Analysis
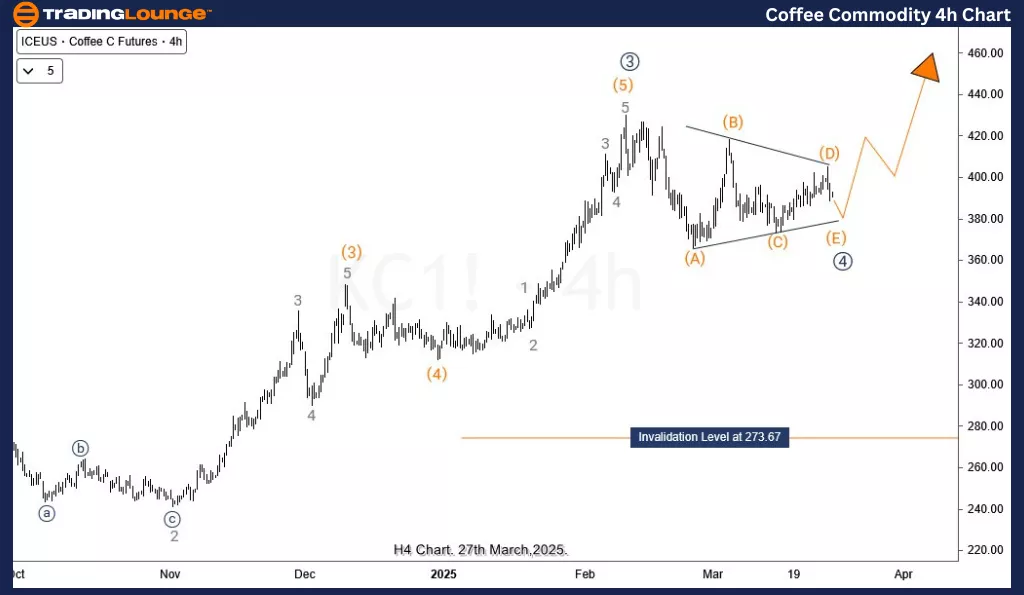
The H4 chart shows the triangle structure for wave ((4)) is close to concluding wave (E) of 4 which must be supported above 373 to keep the structure intact. If that level is breached, then we will expect wave ((4)) to rather go for a double zigzag structure toward 353-313 before wave ((5)) begins.
Technical Analyst : Sanmi Adeagbo
More By This Author:
Elliott Wave Technical Analysis: The TJX Companies Inc. - Thursday, March 27
Elliott Wave Technical Analysis: British Pound/Australian Dollar - Thursday, March 27
Elliott Wave Technical Analysis: Ripple XRP Crypto Price News For Thursday, March 27
At TradingLounge™, we provide actionable Elliott Wave analysis across over 200 markets. Access live chat rooms, advanced AI & algorithmic charting tools, and curated trade ...
more

