

Image by WorldSpectrum from Pixabay
Elliott Wave Analysis – TradingLounge Daily Chart
XRP/ U.S. Dollar (XRPUSD)
XRPUSD Elliott Wave Technical Analysis
Function: Counter Trend
Mode: Corrective
Structure: Flat
Position: Wave ((B))
Next Higher Degree Direction: Wave IV
Invalidation Level: N/A
XRP/ U.S. Dollar (XRPUSD) Trading Strategy
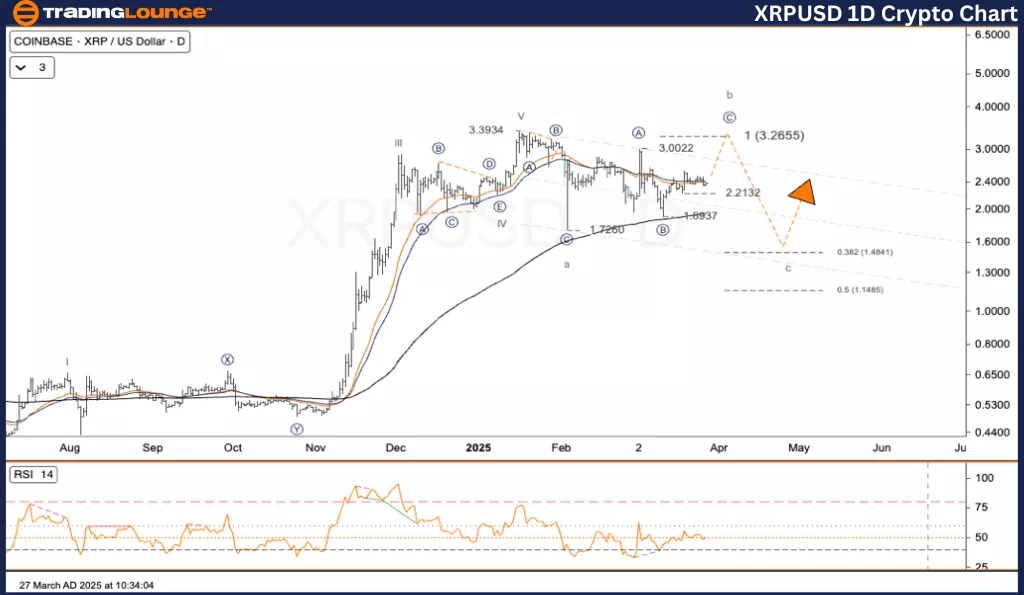
XRP appears to be showing a short-term recovery. However, this move likely represents a “wave b” within a broader correction. If the current Elliott Wave structure continues, the next wave (wave C) could result in a sharp decline. This current setup is identified as a wave (II) correction.
Wave a completed at 1.768
Wave b is ongoing, with major resistance near 3.389
If price fails to surpass this resistance and reverses, wave c could push XRP down toward Key Support: 1.533
Trading Strategies
Strategy
✅ Swing Trading Opportunity (Short-Term)
If XRP fails to break above 2.90 – 3.39 and reverses, short positions may be considered, targeting the 1.53 – 1.60 range.
Risk Management
A clear breakout above 3.389 suggests a possible end to wave (II) and the start of wave (III), requiring a re-evaluation of the current structure.
Elliott Wave Analysis – TradingLounge H4 Chart
XRP/ U.S. Dollar (XRPUSD)
XRPUSD Elliott Wave Technical Analysis
Function: Counter Trend
Mode: Corrective
Structure: Flat
Position: Wave ((B))
Next Higher Degree Direction: Wave IV
Invalidation Level: N/A
XRP/ U.S. Dollar (XRPUSD) Trading Strategy
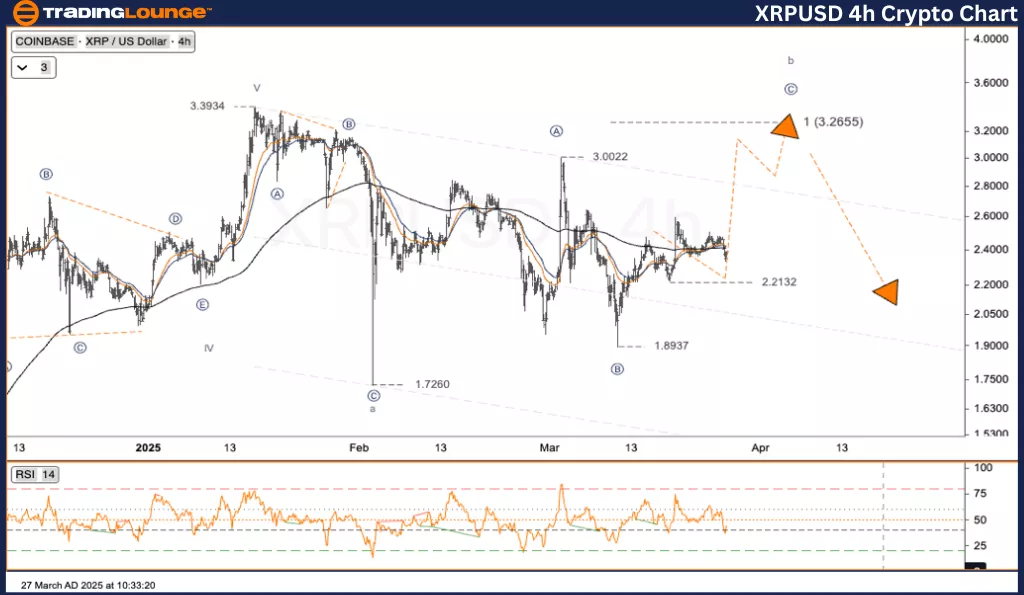
XRP is showing signs of recovery in the short term, which might just be wave b of a broader corrective wave. According to the Elliott Wave pattern, a significant drop may follow if wave c begins. The broader movement is part of a wave (II) correction.
Wave a ended at 1.768
Wave b continues, with resistance around 3.389
A reversal near this resistance could start wave c, aiming for Key Support: 1.533
Trading Strategies
Strategy
✅ Swing Trade Strategy (Short-Term)
Price action rejecting the 2.90 – 3.39 range can offer a short trade opportunity, with targets between 1.53 – 1.60.
Risk Management
A confirmed breakout above 3.389 could end wave (II) and trigger a new bullish wave (III), requiring a shift in analysis.
TradingLounge Analyst: Kittiampon Somboonsod, CEWA
Source: Tradinglounge.com
More By This Author:
Elliott Wave Technical Forecast: Block, Inc.
Elliott Wave Technical Analysis: Caterpillar Inc. - Wednesday, March 26
Elliott Wave Technical Analysis: New Zealand Dollar/U.S. Dollar - Wednesday, March 26


Comments
Log in or sign up to join the conversation.