
Do Sentiment Trends Boost Reflation Odds
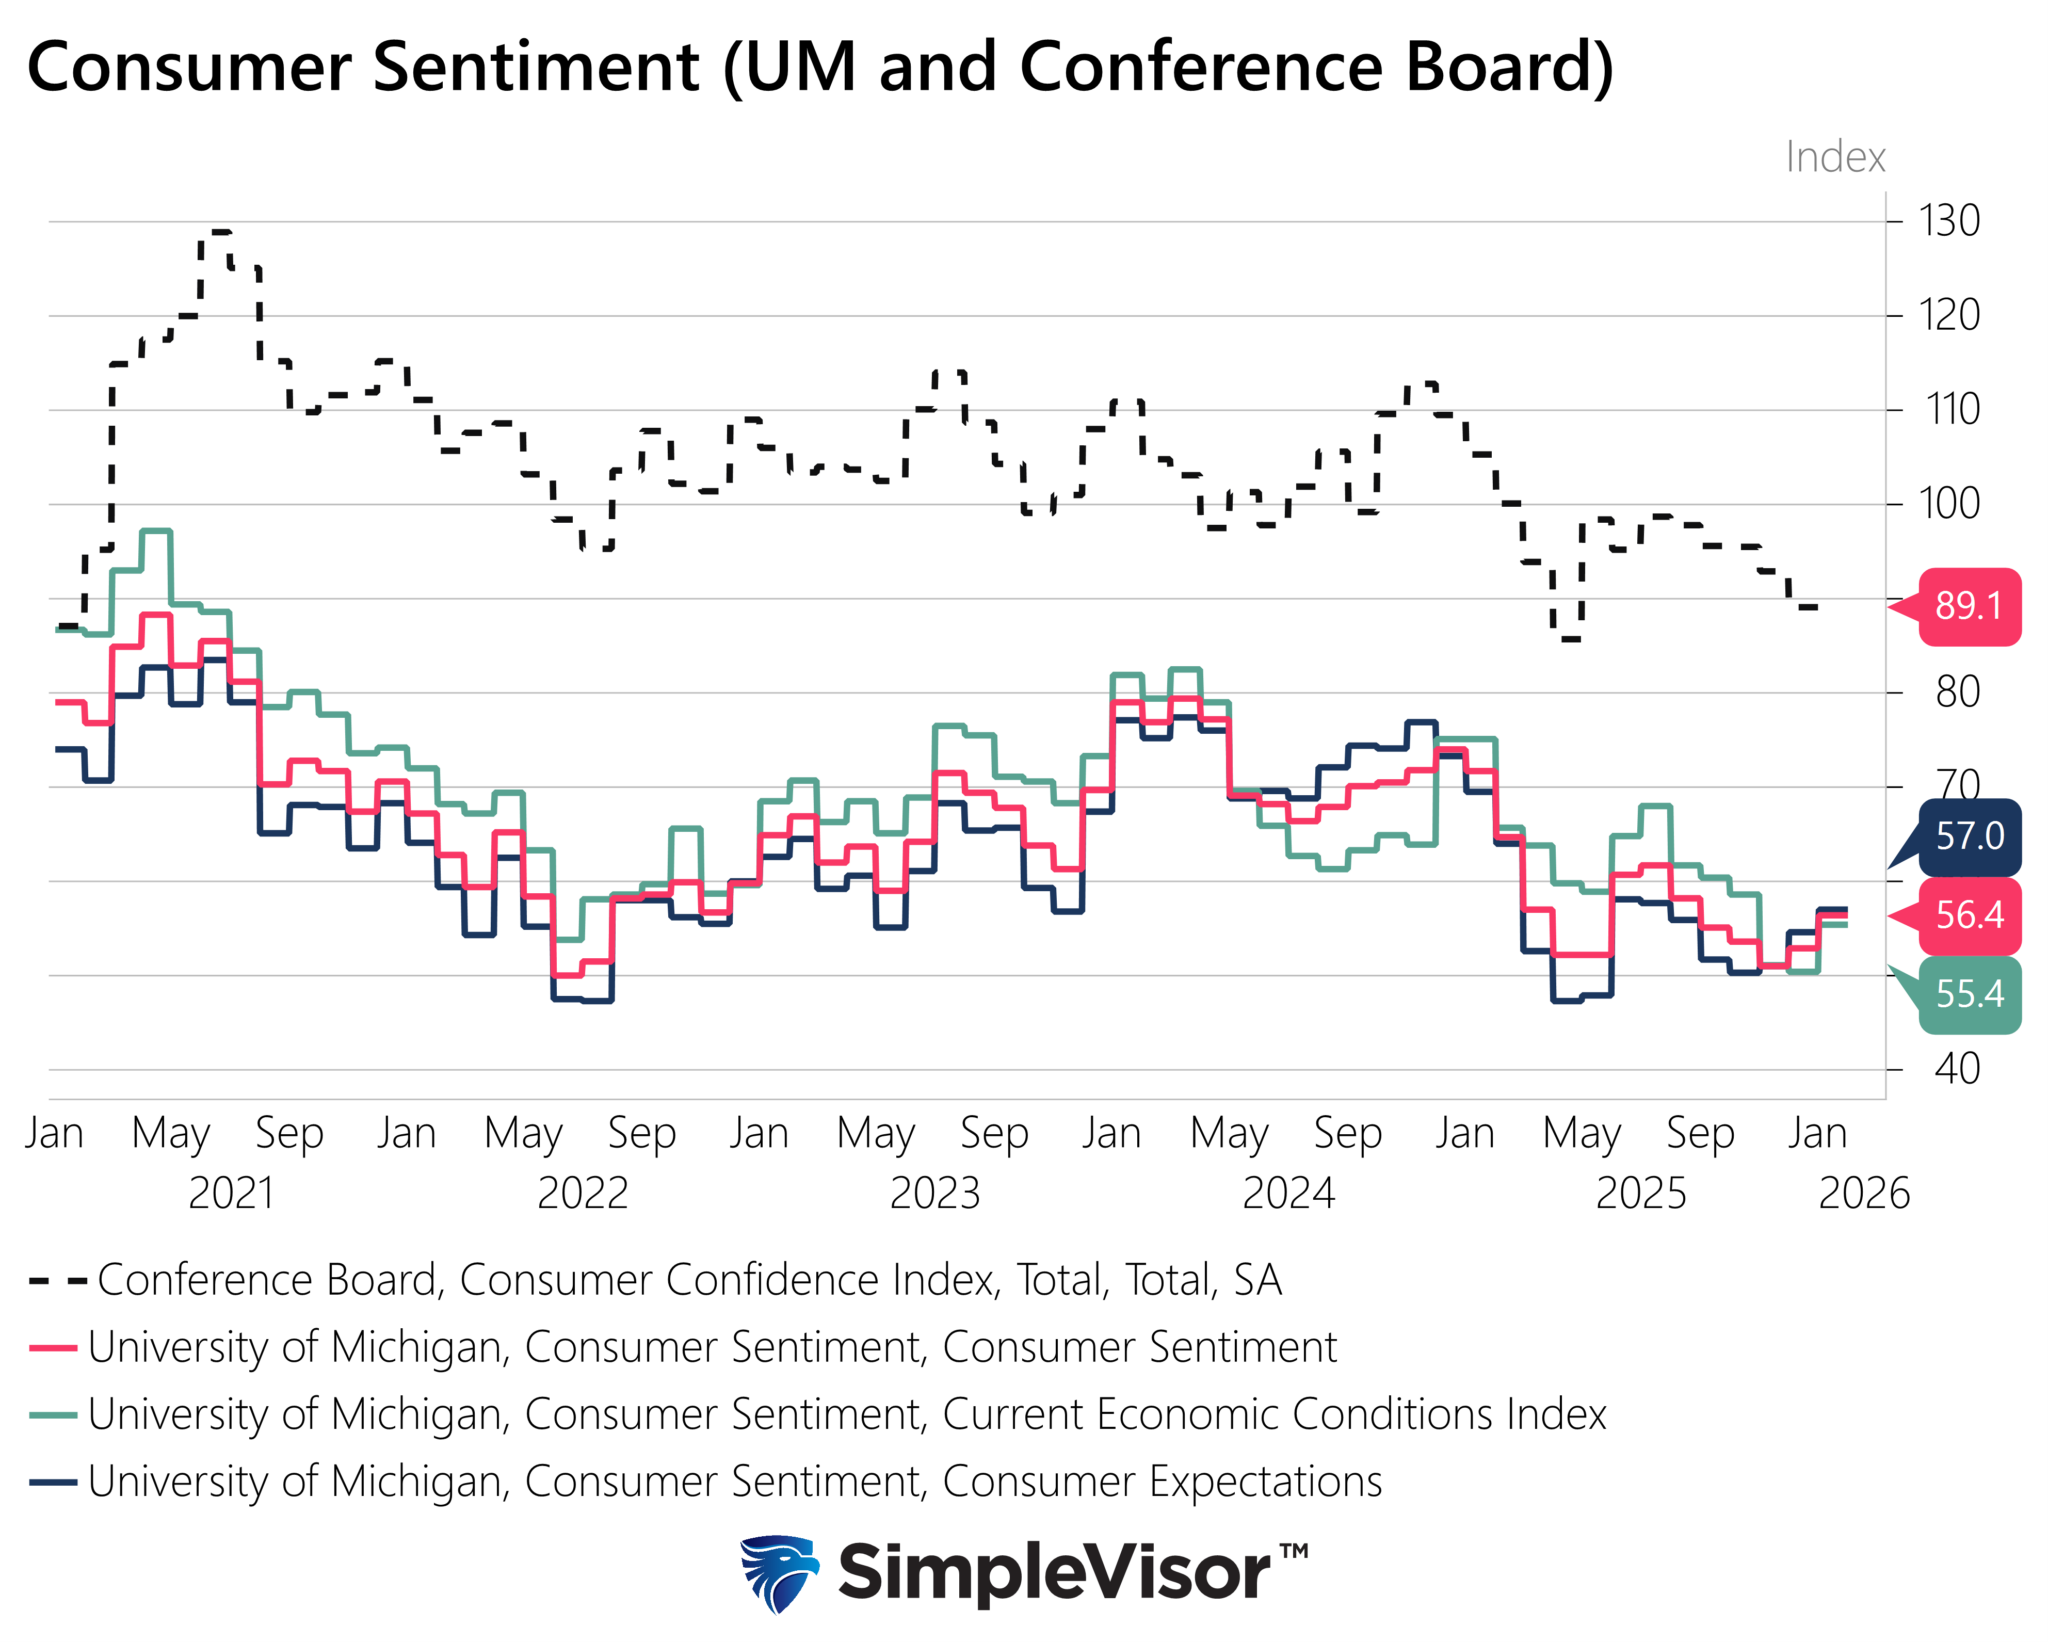
On Monday, we discussed how the Truflation inflation gauge points to a sudden price decline, which clouds the reflation outlook. Today, we share recent consumer sentiment readings that counter the disinflation story and support the reflation narrative. On Friday, the University of Michigan reported that its consumer sentiment index improved in January to a five-month high. The index rose to 56.4, exceeding all of Wall Street’s forecasts and marking the largest increase since June.
Expectations for inflation also eased, with consumers projecting one-year price increases of 4%, the lowest reading in a year. Moreover, longer-term inflation expectations fell to 3.3%. Importantly, concerns about tariffs continue to fade, and buying conditions for durable goods improved. This all suggests that consumers remain willing to spend despite frustration over elevated prices.
While the sentiment trend is encouraging, context matters. The graph below shows the recent uptick in sentiment, but the overall level, as quantified by the University of Michigan and the Conference Board, remains very low. While tax refunds and resilient consumption have helped sustain economic growth, the rebound in sentiment appears reflective of marginal inflation and tariff relief rather than a fundamental improvement in purchasing power.
What To Watch Today
Earnings
(Click on image to enlarge)

Economy
(Click on image to enlarge)

Market Trading Update
Yesterday, we discussed the technical backdrop of the market as earnings season gets fully underway this week. Last week, we made a change to our “All Weather Portfolio” that deserves some discussion, as it raised a few questions. (SimpleVisor subscribers can view the All-Weather Thematic Model Holdings here.)
As we have discussed many times, our job is to manage portfolios to mitigate the risk of catastrophic losses. As such, that process entails a process of:
- Managing positions weights against their target weightings.
- Mitigating the risk of “mean reversions.”
- A regular process of rebalancing portfolios
The second was most important this past week for our Gold and Silver holdings in the model. As a note, the “All Weather Model” maintains permanent exposure to metals, along with value dividend equities, and fixed income to create a total return/income strategy that adjusts for inflation over time. The following chart should fully explain why we reduced our metals holdings back to target portfolio weightings.
Silver is currently trading more than 7 standard deviations above its 200-month moving average, and 340% above that average. Relative strength is also historically extended and is at levels that have coincided with previous peaks. (Critical Note: This is a monthly chart, so these extensions can last for a few months.) The chart also shows that previous such moves have eventually “mean-reverted” to the 200-month moving average, which is currently at $23. While such a reversion may be hard to fathom given the very bullish sentiment in metals, that is just what price history tells us, and we are not willing to take that risk with our client’s wealth.
(Click on image to enlarge)

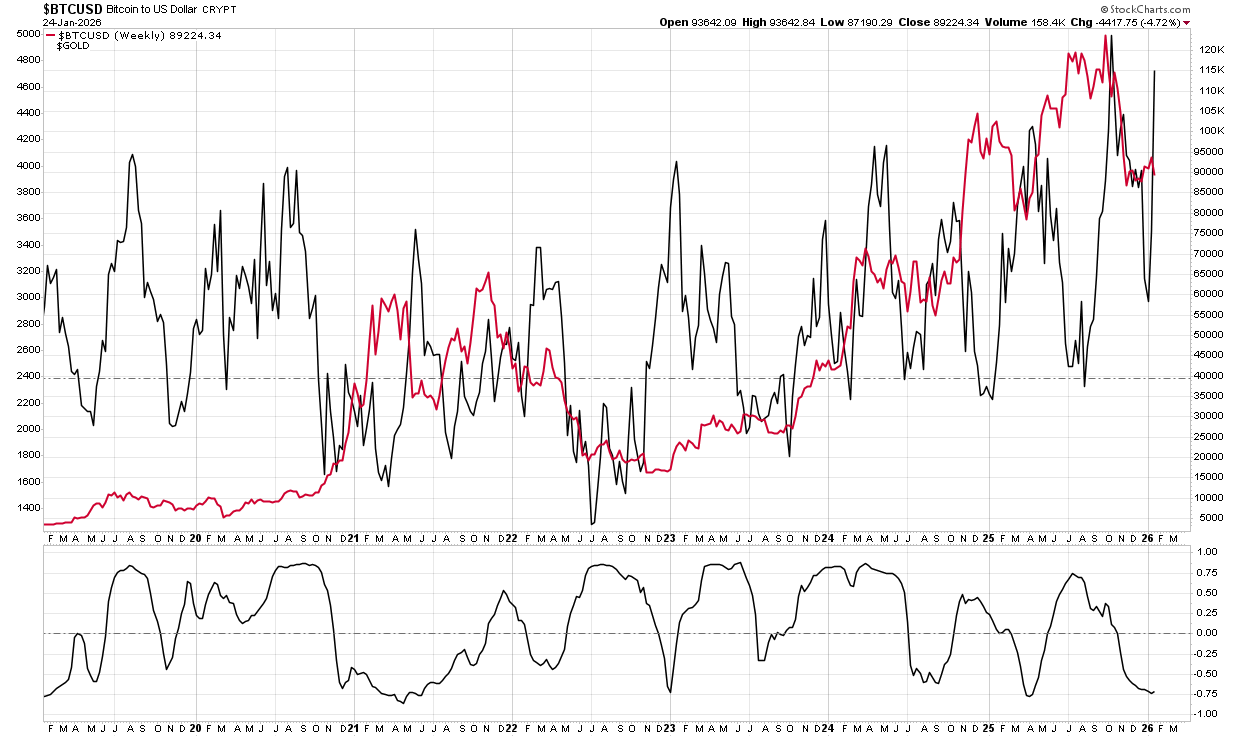
Therefore, as our risk management process dictates, we reduced our positions back to target weights and sought an area of opportunity that was deeply oversold and out of favor, still within the parameters of the portfolio’s “all-weather” makeup. As such, we used the proceeds from our metal reductions to establish a starter position in Bitcoin through the BlackRock Bitcoin ETF. As shown, Bitcoin has become fairly oversold and appears to be building a solid support base. We have kept our initial position relatively small and will look for weakness to build the position, as long as technical support remains intact. With momentum signals turning bullish, we think retail flows could return to this area, particularly if there is a risk-off rotation out of metals.
(Click on image to enlarge)

Furthermore, previous periods of a negative correlation to gold have led to decent rallies in Bitcoin. The chart shows the 12-week ROC for gold versus Bitcoin. While that negative correlation is not perfect, the current extreme bullishness in gold positioning versus the bearish positioning in Bitcoin makes for a compelling arbitrage in portfolios to hedge our remaining metals positions.
(Click on image to enlarge)
As is always the case, we focus on risk management first, and while the market is very bullish for metals, as contrarian investors, that bullishness presents opportunities in more distressed areas of the market.
Is It Time For The Magnificent Seven To Shine?
Over the past couple of months, the once-dominant Magnificent Seven stocks and other mega-cap stocks have stumbled relative to the small-cap, mid-cap, and value factors. Last Friday, we got our first hint that a rotation toward mega-cap stocks could be afoot. On that day, as shown in the first graphic below, courtesy of SimpleVisor, large-cap growth stocks rose nearly half a percent, while small- and mid-cap growth and value fell by 1-2%.
The second graphic highlights the slight turn in their relative and absolute scores. We suspect this may continue as the performance divergence has reached short-term extremes. Moreover, with five mega-cap stocks reporting earnings this week, the odds favor upside if earnings are strong, as their prices are discounted from recent highs. However, bear in mind that a rotation into mega-cap and large-cap growth stocks could be short-lived, and the factor performance of the last month or two could be the playbook for months to come. For now, it’s important to be patient and watch these factors, along with market sentiment, to help assess which factors will lead and lag in February and March.

(Click on image to enlarge)

The Bullish And Bearish Case For 2026
The year ahead presents both a bullish and bearish case for investors. Will 2026 be another year of above-average returns, or will it be a year of disappointment? The bulls argue that the key ingredients for a sustained rally are in place. A powerful technology cycle, aggressive corporate spending, and supportive policy measures all point to further gains. Conversely, the bears argue that key drivers are weakening, market leadership is dangerously narrow, and signs of economic strain are becoming increasingly visible beneath the surface.
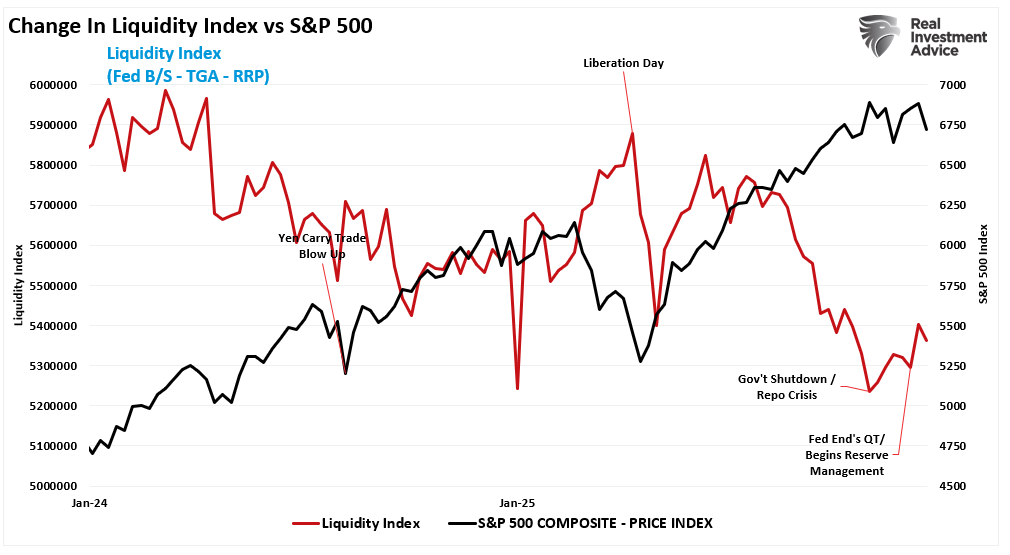
Following a strong 2025, many investors are now facing a different market regime. Liquidity remains ample, but concerns around valuation, employment pressure, and consumer health are rising. The outcome depends on how long optimism can prevail over reality, and whether the hoped-for gains from artificial intelligence and capital expenditures materialize in time to offset the economic drag from debt, interest rates, and inequality.
Sentiment indeed remains positive, although not universally so. Equity strategists are divided, and bond markets are pricing in both rate cuts and the risk of a recession. Furthermore, while fiscal stimulus could delay any downturn, it also adds to long-term imbalances. The challenge for investors is staying objective. While both the bull and bear cases have merit, the timing of outcomes will be critical, and the reality is that in 2026, both the bullish and bearish cases could be correct. Therefore, the right strategy will be the one that adapts.
Let’s break down both the bullish and bearish scenarios for 2026 and examine the arguments on each side. READ MORE…
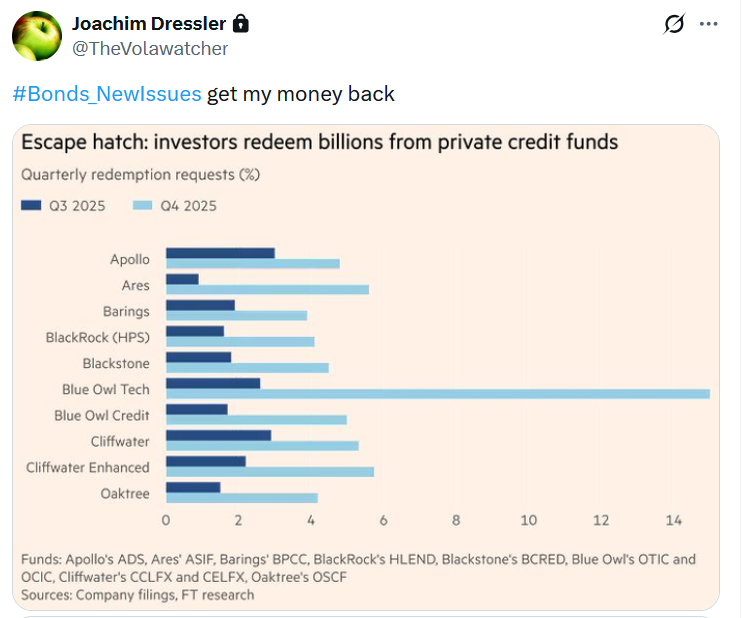
Tweet of the Day
More By This Author:
The Bullish And Bearish Case For 2026The Reflation Narrative Stumbles Out Of The Gate
Investment Risk Is Underappreciated
Disclaimer: Click here to read the full disclaimer.


