
Following futures positions of non-commercials are as of June 4, 2024.
10-year note: Currently net short 454.8k, up 66.6k.
(Click on image to enlarge)

The FOMC meets next week. This will be the fourth meeting this year, and four more remain. The fed funds has been held steady for the sixth meeting in a row. The last hike was last July, when the benchmark rates reached a range of 525 basis points to 550 basis points, up from zero to 25 basis points in March 2022. The rates will certainly be left unchanged for the seventh consecutive meeting next week. The all-important question revolves around what happens in the second half of the year.
As things stand, the FOMC is focused on inflation, which has come down dramatically from four-decade highs of 2022, but at the same time seems to be stalling fairly above the Federal Reserve’s two percent target. The other part of the central bank’s mandate is jobs, where signals are mixed.
In May, the US economy produced a much-better-than expected 272,000 non-farm jobs, which all but closed the door on chances of a July cut. Forward-looking data, however, signal incipient weakness. Non-farm job openings in April dropped 286,000 month-over-month to 8.1 million, which is 4.1 million less than the March 2022 peak of 12.2 million. That said, right here and now, this likely is not going to move the needle for the Fed.
Amidst this comes out May’s CPI early Wednesday, which is the day the FOMC ends its meeting, followed by a presser by Chair Jerome Powell. Any hot reading and markets will continue to price out the odds of a cut this year. Thus far, futures traders expect one cut – in November, with the meeting scheduled to take place two days after the 5th elections. At this juncture, the risk they face is to the downside – no cut, versus upside of two cuts or more.
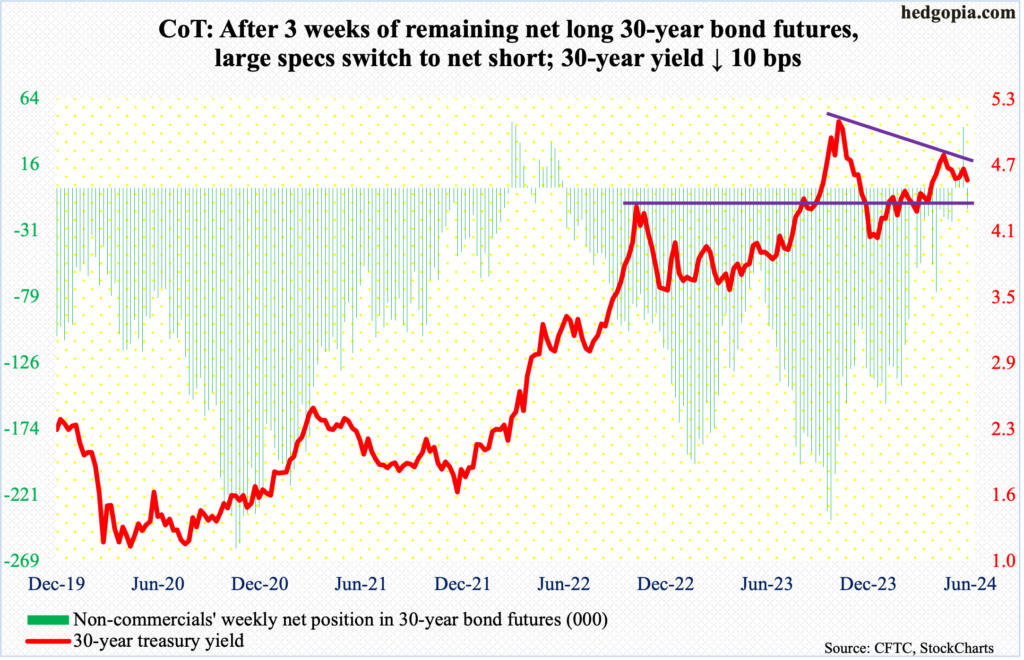
30-year bond: Currently net short 15.5k, up 59.3k.
(Click on image to enlarge)
Major US economic releases for next week are as follows.
The NFIB optimism index (May) will be published Tuesday. April small-business optimism firmed up 1.2 points m/m to 89.7 – a three-month high.
Wednesday brings the consumer price index (May). In the 12 months to April, headline and core CPI increased 3.4 percent and 3.6 percent, in that order. In June and September of 2022 respectively, these two measures were growing at four-decade highs of 9.1 percent and 6.6 percent.
The producer price index (May) is on dock for Thursday. From a year ago, headline and core wholesale prices rose 2.2 percent and 2.4 percent respectively.
The University of Michigan’s consumer sentiment index (June, preliminary) comes out Friday. Sentiment tumbled 8.1 points m/m in May to 69.1 – a five-month low. March’s 79.4 was the highest since July 2021.
WTI crude oil: Currently net long 224.6k, down 59.9k.
(Click on image to enlarge)
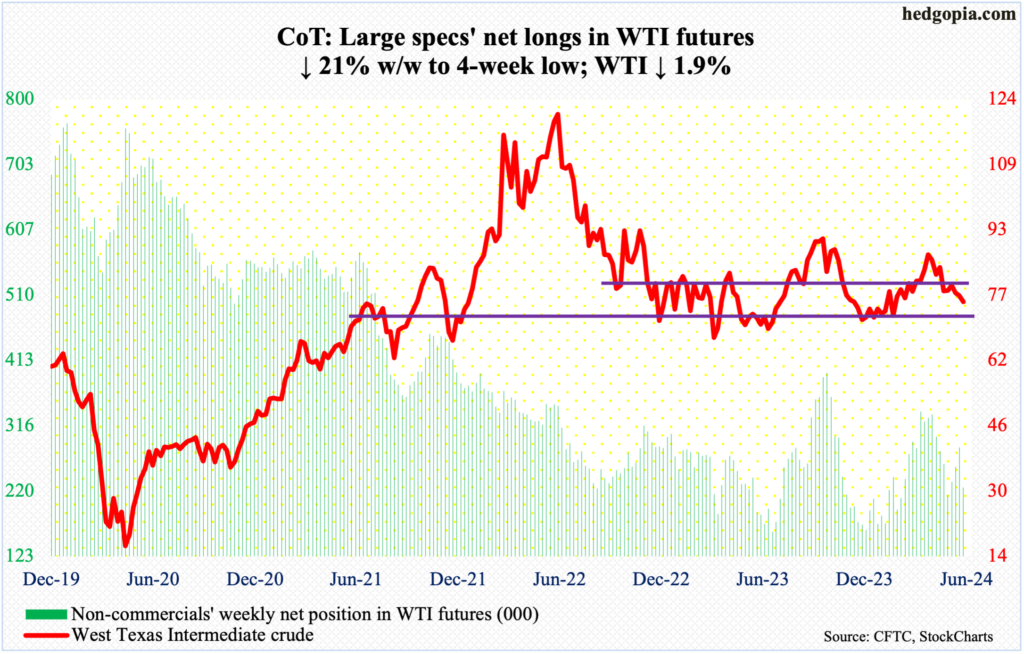
In the wake of a breach last week of a rising trendline from last December when West Texas Intermediate crude bottomed at $67.71, there was more selling this week, dropping 1.9 percent to $75.53/barrel.
From oil bulls’ perspective, the good thing is that the crude finished the week substantially off its low. On Tuesday, it tagged $72.48 intraday. This just about tested the low end of a range between $71-$72 and $81-$82 that persisted for 19 months before the upper end gave way 10 weeks ago and was subsequently lost early May.
The weekly produced a bullish hammer. Odds favor a rally. Immediate resistance lies just under $77.
In the meantime, US crude production in the week to May 31st was unchanged for 13 consecutive weeks at 13.1 million barrels per day; 15 weeks ago, output was at a record 13.3 mb/d. Crude imports increased 289,000 b/d to 7.1 mb/d. As did stocks of crude, gasoline, and distillates, which respectively grew 1.2 million barrels, 2.1 million barrels and 3.2 million barrels to 455.9 million barrels, 230.9 million barrels and 122.5 million barrels. Refinery utilization increased 1.1 percentage points to 95.4 percent.
E-mini S&P 500: Currently net short 65k, up 62.8k.
(Click on image to enlarge)
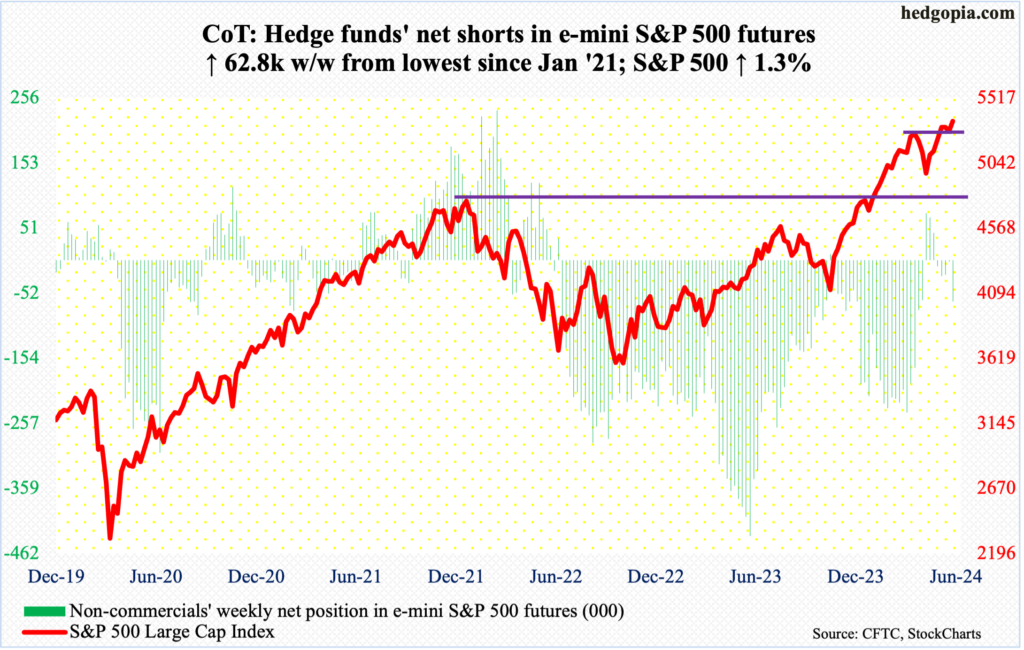
Leading up to this week, the S&P 500 developed a weekly hanging man preceded by a long-legged doji. Last week’s hanging man in particular, if confirmed this week, would have given the bears much-needed momentum – at least near term – but that was not to be.
The week began with intraday weakness on both Monday and Tuesday, but it was bought. By Friday, a new intraday high of 5375 was recorded, although the large cap index was unable to hang on to the gains, finishing the session/week at 5347, up 1.3 percent for the week.
In three sessions through Tuesday, horizontal support at 5260s was breached intraday but only for bids to show up on time to reclaim it by close. Bulls are holding on to the momentum ball and are fine until they lose 5260s.
Euro: Currently net long 67.9k, up 10.3k.
(Click on image to enlarge)
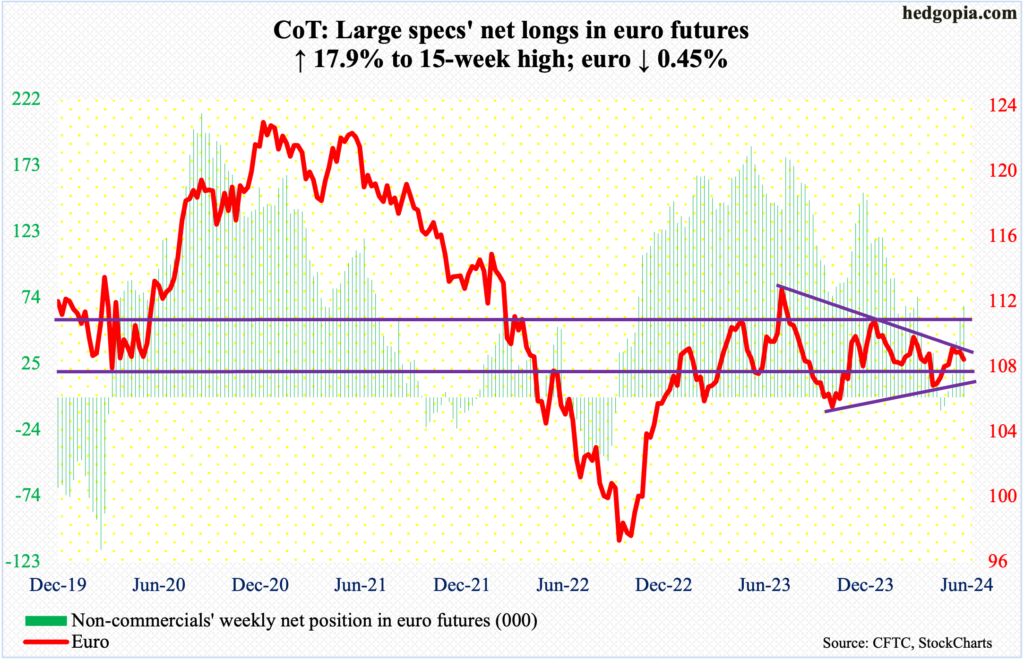
For the fourth week in a row, euro bulls faced rejection at $1.09 or just underneath. This week, $1.0902 was ticked on Thursday, but this was followed by Friday’s 0.8-percent smackdown, ending the week down 0.45 percent to $1.0802.
In the end, trendline resistance from last July when the euro retreated after touching $1.1270, held. There is also a rising trend line from last October, which draws to just north of $1.06. The currency remains trapped in the resulting symmetrical triangle.
This week’s action came at a time when the European Central Bank cut its benchmark rates by 25 basis points – frontrunning the Federal Reserve, which in and of itself is unprecedented. But the cut is viewed as a hawkish development, as the central bank warned inflation will likely remain above the two percent target well into next year.
The currency’s path of least resistance is toward the lower trendline support.
Gold: Currently net long 237.3k, up 717.
(Click on image to enlarge)
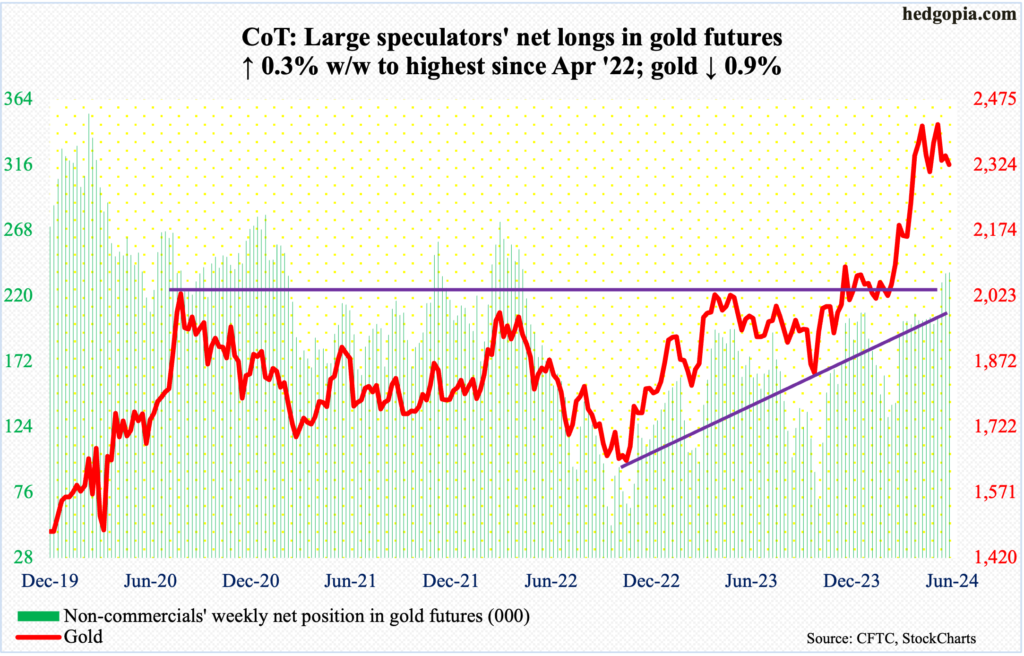
After essentially hugging the 50-day for 10 consecutive sessions, gold sliced through the average on Friday. For the week, it declined 0.9 percent to $2,325/ounce. A loss of $2,300 – which seems imminent in the sessions ahead – will open the door toward horizontal support at $2,240s.
Earlier, gold printed a fresh high of $2,454 on May 20th before going the other way. The metal has come a long way. Last October, it ticked $1,824 and was at $1,996 this February. It is healthy to digest these gains by unwinding the overbought condition gold is in – the weekly in particular.
Nasdaq (mini): Currently net long 2k, up 5.7k.
(Click on image to enlarge)
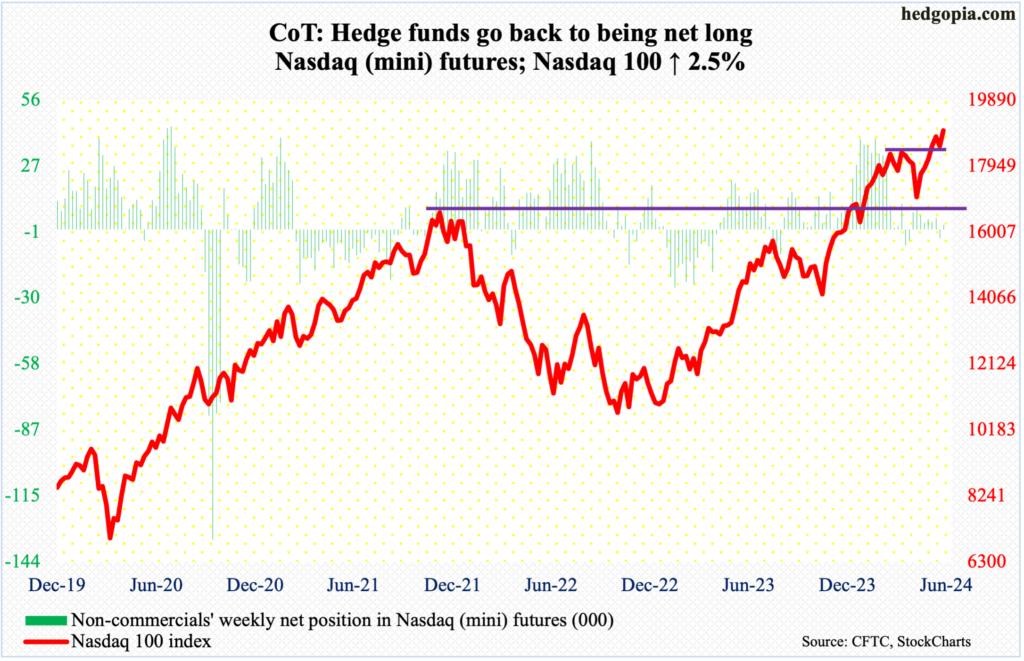
Last Friday, three-month horizontal support at 18300s was breached intraday but only to then attract massive buying interest to finish the session with a dragonfly doji. This Monday, intraday weakness was again bought just above that support. With the momentum wind at their back, tech bulls notched a new intraday high of 19114 on Friday, ending the week up 2.5 percent to 19001.
That said, the weekly RSI is making lower lows. This week, the metric ended just north of 66, versus mid-70s in February.
Investor fascination with the likes of Nvidia (NVDA), which now commands a three-trillion-dollar market cap, continues. Pre-earnings on May 22nd, the stock closed at $950; this Thursday, it tagged $1,256. In the fullness of time, such exuberance hardly ends well. It is tempting to say this time it is different. It seldom is.
Russell 2000 mini-index: Currently net short 34.4k, up 510.
(Click on image to enlarge)
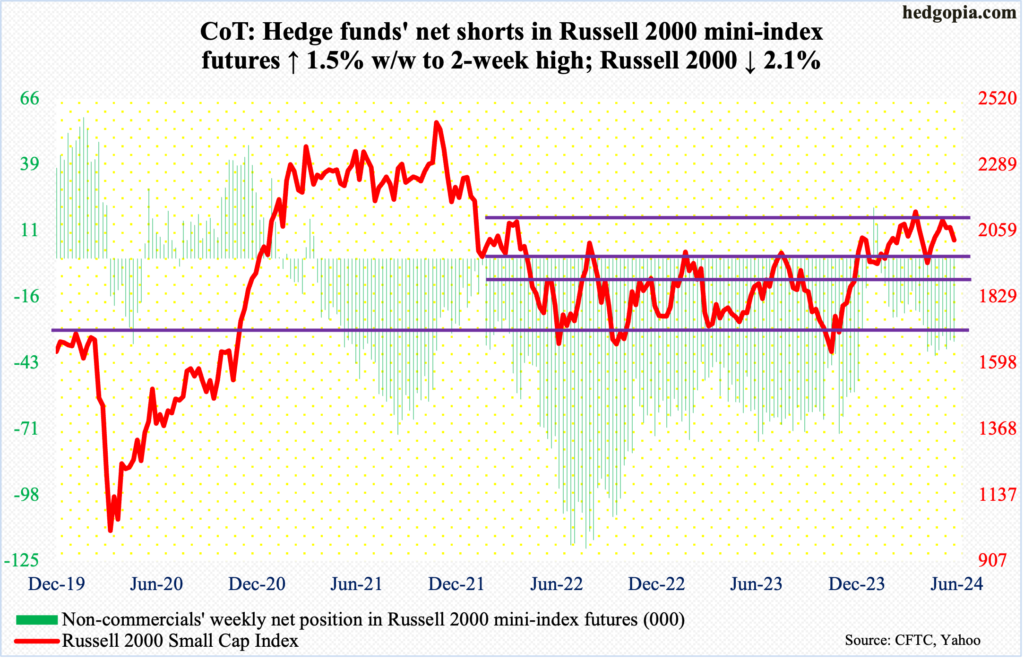
Small-caps diverged with their large-cap cousins this week. The Russell 2000 was down 2.1 percent to 2027, with Friday’s intraday low of 2023 near horizontal support at 2000. The index has also been trading within a descending channel since May 15th when it tagged 2112 and headed lower; Friday’s low tested that support.
The index has traded above 2000 since early last month, while 2100 has stood like a mountain since early March.
The small cap index peaked in November 2021 at 2459, subsequently reaching 1641 in June 2022, which was successfully tested in October of both 2022 and 2023. A 61.8-percent Fibonacci retracement of that drop tallies to 2144. The index lost 2100 in January 2022 and has since struggled at that price point; 2100 also represents a measured-move price target post-breakout at 1900 last December. Before that, the index went back and forth between 1700 and 1900 going back to January 2022.
Small-cap bulls have an opportunity here to put their foot down. Inability to do so would hasten a move toward 1900.
US Dollar Index: Currently net long 4.9k, up 713.
(Click on image to enlarge)
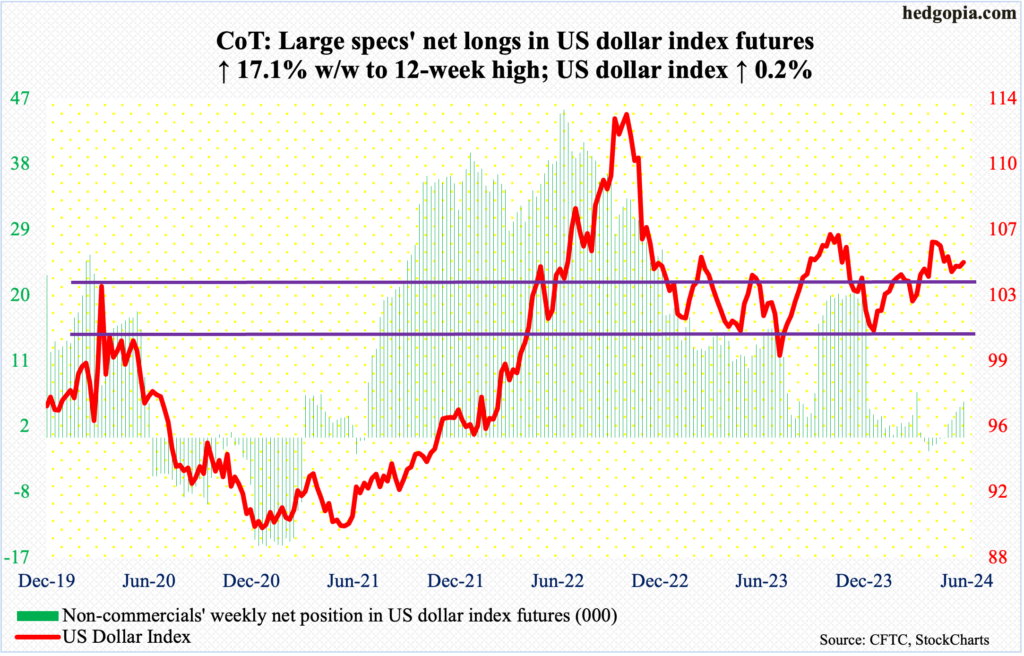
A rising trendline from last December when the US dollar index bottomed at 100.32 was breached intraweek but was saved by the end of the week. The index closed up 0.2 percent to 104.86, forming a weekly bullish hammer.
The index has trended lower since touching 106.38 on May 1st; back then, it struggled north of 106 for four consecutive weeks before weakening.
Dollar bulls now have a decent opportunity to reverse higher. Horizontal support at 103-104 goes back to December 2016, and it is holding.
VIX: Currently net short 41.3k, down 1.5k.
(Click on image to enlarge)
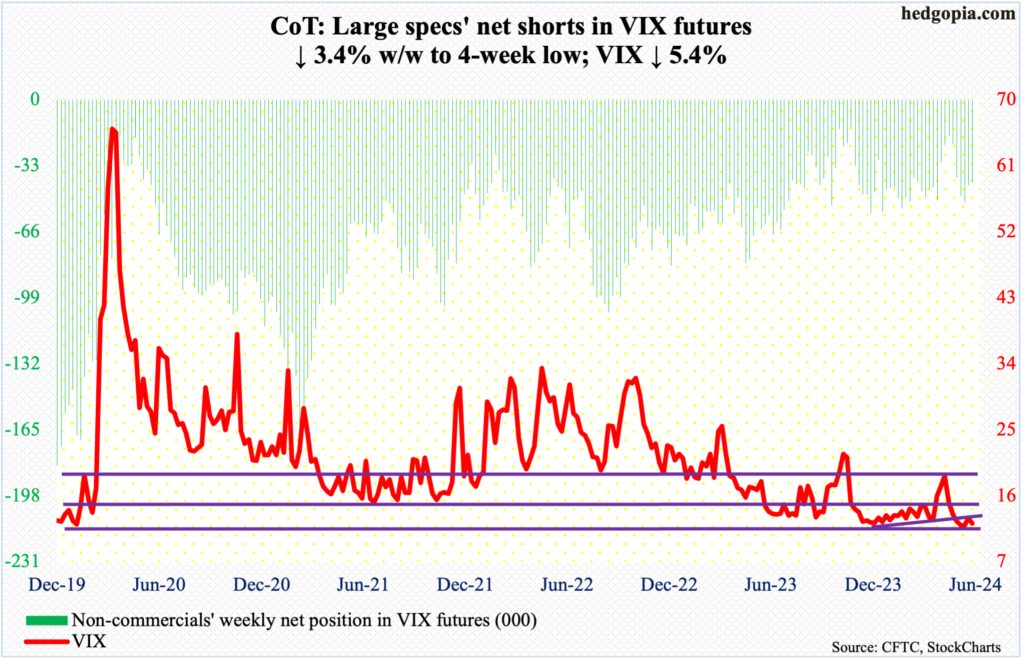
Last Friday, VIX was vehemently denied at the 50- and 200-day (now 14.39 and 14.59 respectively) as it retreated from 14.87. This Friday, it tagged 12.11 intraday to close at 12.22. On May 3rd, it dropped as low as 11.52 before reversing higher; this level is a must-hold.
Going back six years, volatility bulls have repeatedly defended 12 and deserve to be given the benefit of the doubt.
Thanks for reading!
More By This Author:
Back-To-Back Hanging Man Forms On S&P 500, But Pattern Needs Confirmation
CoT: Peek Into Future Thru Futures, Hedge Funds Positioning
On Back Of Soft Demand For Treasury Auction, 10-year T-yield Rallies To Upper End Of Symmetrical Triangle


Comments
Log in or sign up to join the conversation.