
Copper’s Bull Market Is About To Begin
For those who missed the earliest stages of the gold and silver bull markets, copper appears to be the next metal poised for a major bull run.
Anyone who has followed my writings over the past year knows that, in addition to being consistently bullish on gold, silver, and mining stocks, I’ve also been very bullish on copper and have published numerous analyses on it.
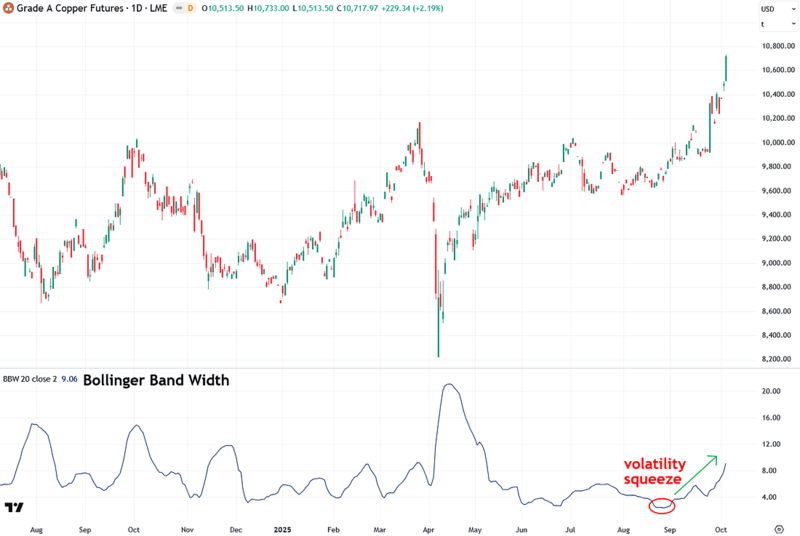
Most recently, on August 27th, I released a report explaining that copper was experiencing a volatility squeeze that virtually guaranteed a major move ahead.
Sure enough, that move began just weeks later and is now helping to ignite the major bull market in copper that I’ve been anticipating and writing about all year. This is also excellent news for silver investors, as I’ll explain in a moment.
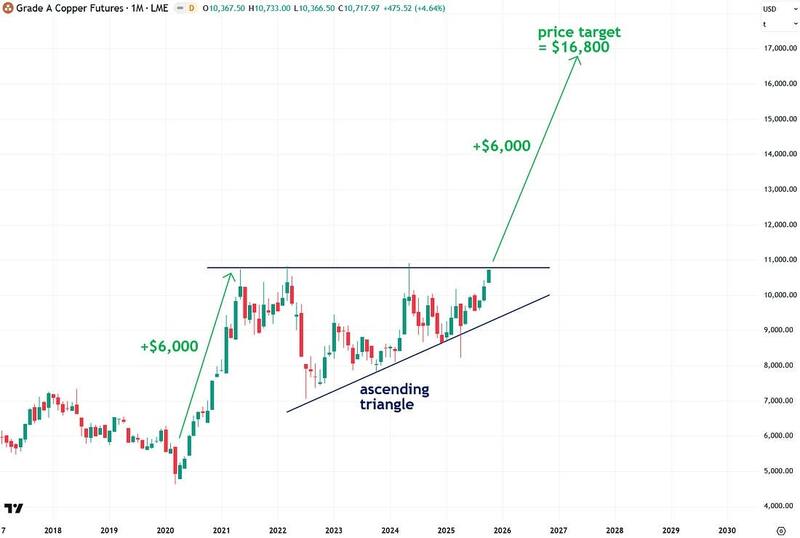
So let’s take a look at what’s happening in the chart of Grade A copper futures traded on the London Metal Exchange (LME).
I prefer following that contract instead of the more popular High Grade Copper futures traded on the U.S. COMEX exchange, ever since the Trump administration’s bungled tariff announcements earlier this spring caused severe price distortions and made COMEX copper virtually useless for technical analysis. Like COMEX copper, LME copper futures are priced in U.S. dollars, but quoted per metric tonne rather than per pound.
As we can see, copper prices have surged in recent weeks for a variety of reasons. The primary immediate catalyst was a major disruption at the massive Grasberg mine in Indonesia, the world’s second-largest source of copper, following a serious accident that Goldman Sachs called a “black swan event.”
Other bullish factors include a weaker U.S. dollar, growing optimism about AI and electrification-related demand, expectations of U.S. interest rate cuts, and a broad rally across the metals complex.
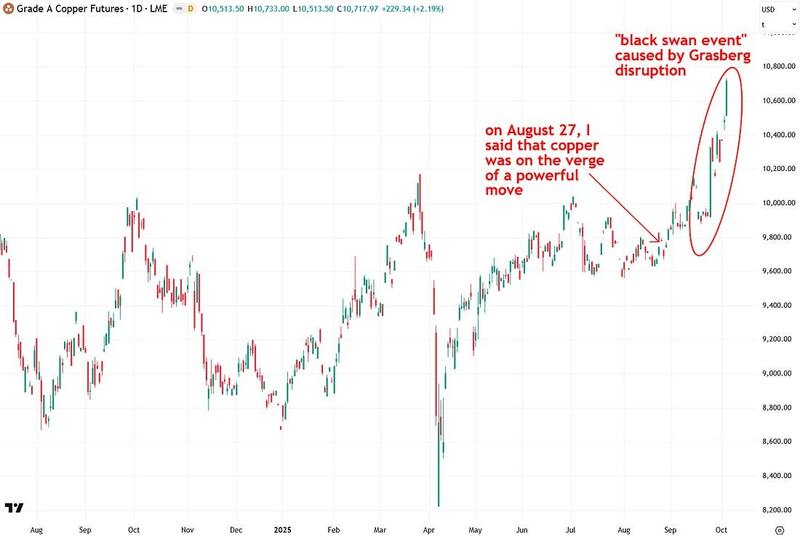
While there was no way to predict the exact catalyst behind copper’s big move, I was adamant in my August 27th report that a major move was coming.
That confidence was based on a highly unusual volatility squeeze, one of the most extreme in years, and sure enough, the sharp breakout we’ve seen is a direct fulfillment of those expectations.
And it is likely only the beginning. Let this serve as a reminder of the value of spotting and respecting volatility squeezes.
Although the recent Grasberg mine disruption and copper price surge are both notable and exciting for us copper bulls, I find the longer-term picture even more compelling.
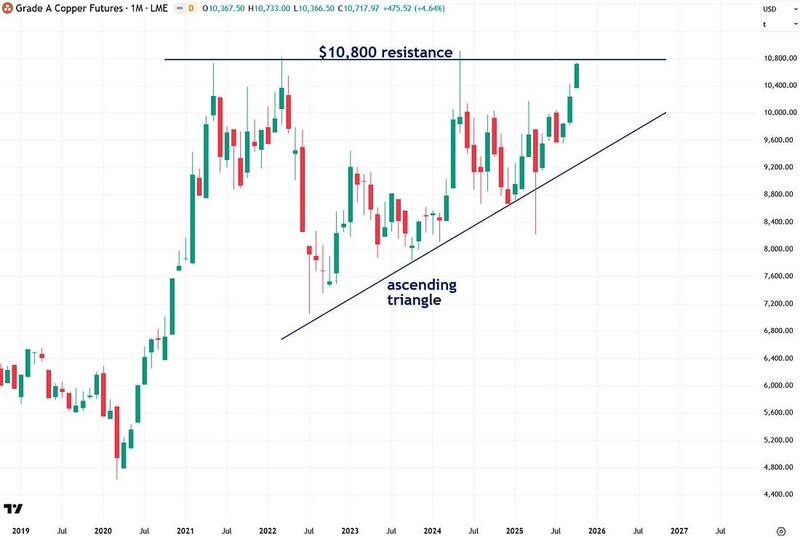
When I step back and look at the monthly chart, it shows that copper is on the verge of breaking out of the ascending triangle pattern I’ve been tracking and highlighting for some time. I believe that a monthly close above the $10,800 resistance level would signal that a powerful new copper bull market has officially begun.
For those who feel they missed out on gold’s bull market, which is still far from over, or who didn’t buy as much as they would have liked at lower prices, copper may be giving you a second chance to enter before another major bull run.
I believe this next move could be similar in magnitude to gold’s rally over the past two years. I will discuss the bullish fundamentals of copper later in this report, but for now, I want to first highlight the bullish technical setup.
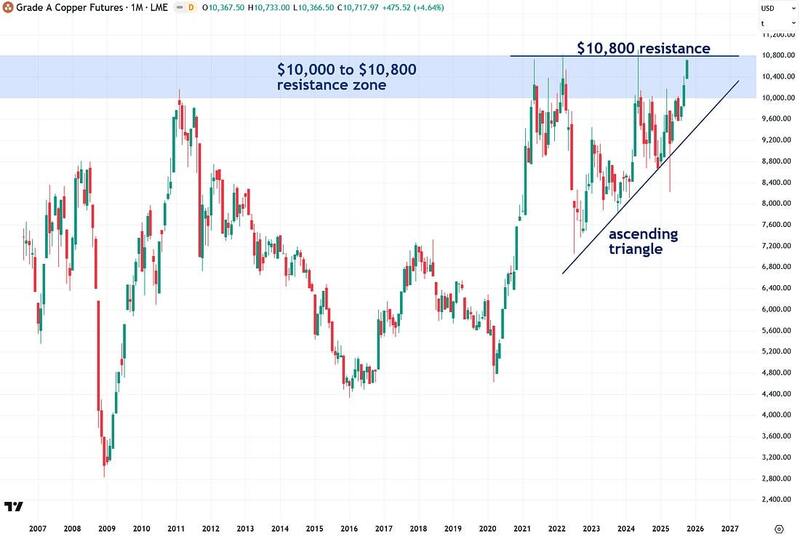
Looking at the even bigger picture, going back two decades reveals both the ascending triangle and the key $10,000 to $10,800 resistance zone, which first formed in 2011 and has been reinforced by multiple peaks over the past several years.
I sincerely believe that once copper closes decisively above this resistance zone, a truly epic bull market will follow, and I am genuinely excited about it.
What’s exciting is that copper’s ascending triangle pattern allows us to project a price target using a powerful and useful technical analysis method called a measured move. To apply it, we measure the size of the move leading into the pattern, which in this case was $6,000 per metric tonne.
We then project that same amount upward from the top of the pattern, which is $10,800. Adding $6,000 to the $10,800 breakout level gives us a projected target of $16,800 per tonne, representing an impressive 56% gain. That is the minimum price copper is likely to reach after breaking out from its triangle pattern.
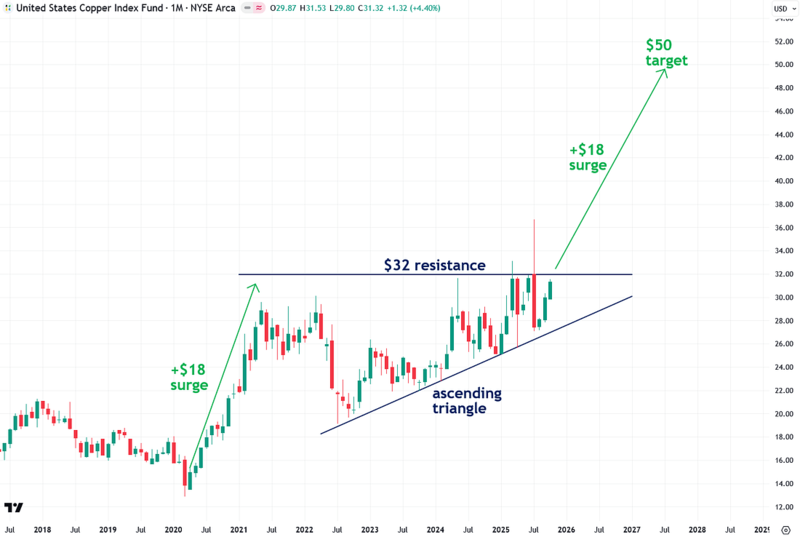
Now, let’s look at some ways to play the likely upcoming copper bull market. My preferred approach is to keep it simple and straightforward by using the United States Copper Index Fund, symbol CPER.
This fund tracks the price of copper and should generally deliver similar percentage gains. The ascending triangle pattern is visible on CPER’s chart as well, and its measured move projects a price target of $50 from a breakout point of $32, which represents a 56% gain. Not too shabby!
The one caveat is that CPER must close decisively above the $32 resistance level and remain above it for the bullish thesis to stay valid. If it were to break out briefly but then close solidly back below that level, that would be my signal to cut losses.
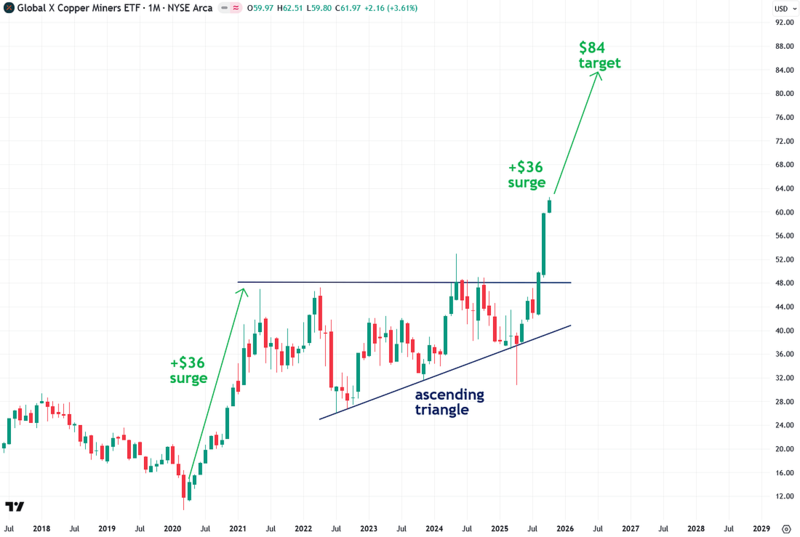
I also like the Global X Copper Miners ETF, symbol COPX, and I alerted subscribers to its bullish setup back in March. Since then, it has broken out just as I expected. I still believe it has room to run and should rise to around $84 based on the measured move principle.
My only reservation is for those who are not already in it. I would avoid chasing it here, since it has already broken out and is now quite extended from its breakout point.
That makes it more vulnerable to a short-term pullback. There could still be another opportunity to enter after a pullback or period of consolidation, however.
Now that I’ve explored the bullish technical case, I want to focus on the fundamental side, starting with valuation metrics. I’m a big fan of using these when analyzing commodities to determine whether they are cheap or expensive relative to history, based on a variety of different yardsticks.
(For this series of charts, I was forced to use the more popular High Grade Copper futures traded on the U.S. COMEX exchange rather than my preferred LME copper futures contract.
The reason is simply that COMEX data goes back many decades, whereas LME copper futures data does not. That said, it is important to understand that the two are historically highly correlated, except for the recent distortions caused by the Trump administration’s chaotic tariff rollout.
As a reminder, COMEX copper is quoted in U.S. dollars per pound, while LME copper is quoted in U.S. dollars per metric tonne.)
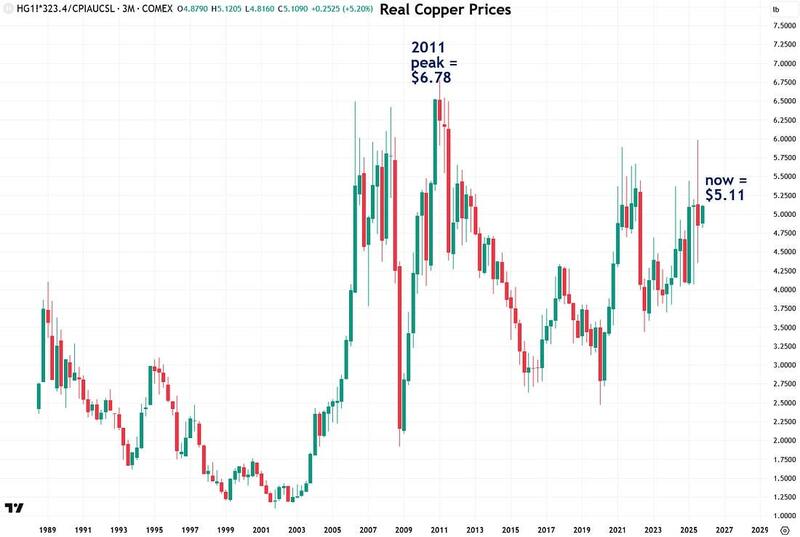
My first step is always to look at a commodity in real, or inflation-adjusted, terms. In copper’s case, this shows that it is currently fairly valued, neither too cheap nor too expensive.
Its inflation-adjusted peak in 2011 was $6.78 per pound, while it stands at $5.11 now. I believe this shows that copper still has plenty of room to move higher and will likely surpass its 2011 peak quite aggressively.
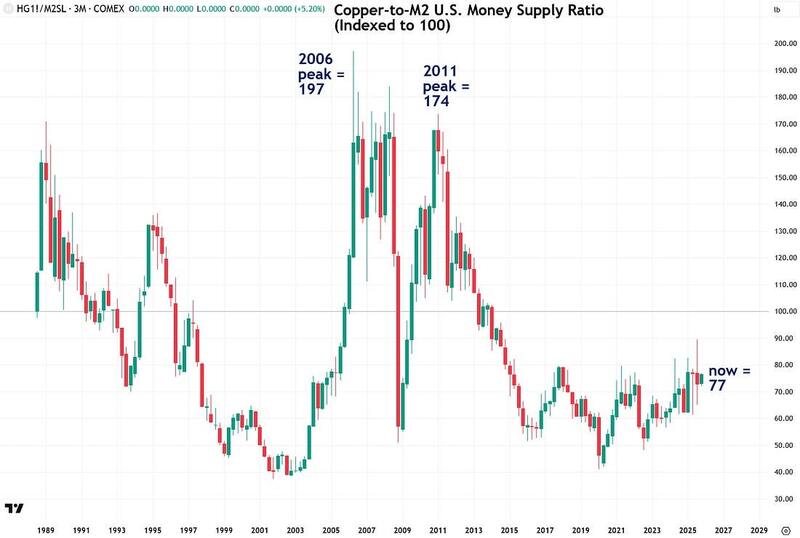
The next chart shows the ratio of copper to the U.S. M2 money supply, indexed to 100. This may be an even more accurate gauge of inflation than the Consumer Price Index (CPI), which was used to create the previous chart.
After all, the root cause of inflation is growth in the money supply itself. As Milton Friedman, the Nobel Prize–winning economist, famously said, “Inflation is always and everywhere a monetary phenomenon.”
Now this is where things get really interesting, because this metric shows that copper is quite undervalued. Its index value currently stands at just 77, compared to prior peaks of 197 in 2006 and 174 in 2011. This indicates that copper has plenty of room to move higher without even needing to reach new all-time highs.
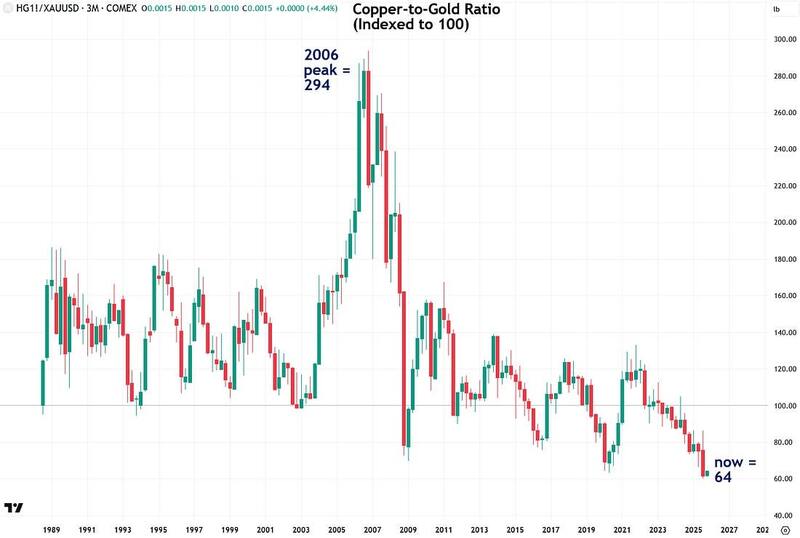
When analyzing commodities, especially metals, I like to compare them to gold as a baseline reference point. This metric confirms that copper is quite undervalued, with the index currently at just 64 compared to its 2006 peak of 294.
This is exactly the kind of setup that is encouraging to see if you are anticipating and positioning for a powerful bull market, as I am.
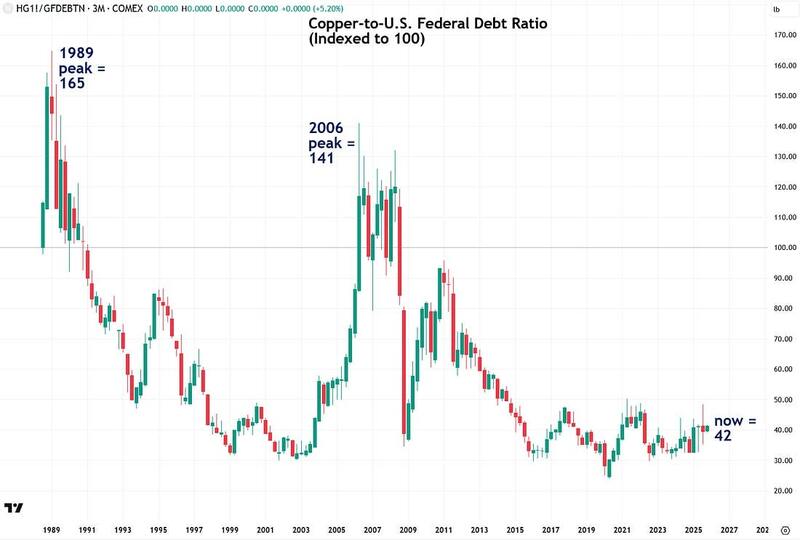
Another metric I’ve recently come to appreciate for analyzing commodities is their ratio to the U.S. federal debt, which now stands at $37.8 trillion and is growing at an alarming pace of $1 trillion every 100 days with no signs of slowing down.
This metric is important because it reveals whether the price of copper has kept pace with the explosive growth of the national debt, and the answer is clearly no.
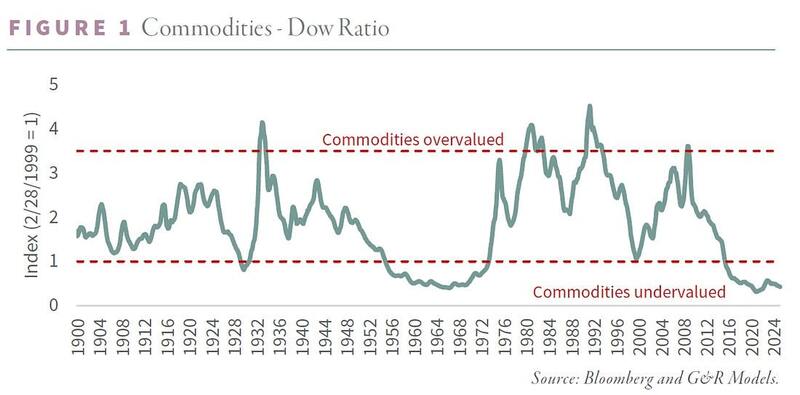
I also like to compare commodities against the yardstick of the Dow Jones Industrial Average. This comparison is valuable because there is a long-established relationship between commodities and stocks, with capital rotating between them in long-term secular phases. In many ways, they serve as counterbalances to each other.
This valuation metric also confirms what the others have shown, which is that copper is quite cheap right now. For example, the index is currently at just 26, compared to its 1989 peak of 164 and its 2011 peak of 91.
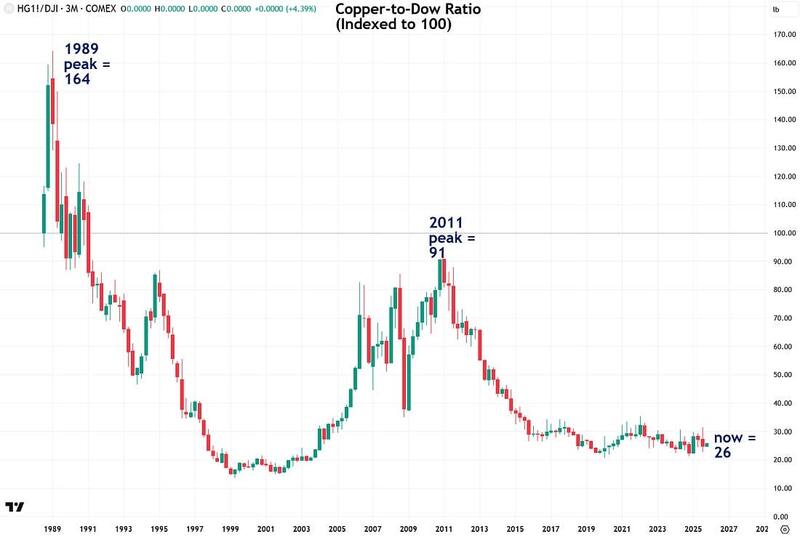
By the way, the above chart of the copper-to-Dow ratio and how low it is reflects a broader phenomenon of commodities being deeply undervalued across the board relative to equities.
As the chart below shows, this kind of setup has historically preceded major commodity supercycles or secular bull markets, such as those in the 1970s and 2000s. I believe another supercycle is about to begin.
Here’s how I expect this to play out: the extremely overvalued stock market will eventually come back down to earth, and trillions of dollars will flow out of it and into undervalued commodities and the natural resources sector, causing a major boom.
Now that I’ve covered the valuation side of the fundamental thesis, I also want to highlight the bullish demand outlook for copper in the years ahead. Demand for copper is already strong and is expected to grow substantially in the coming decades. Goldman Sachs even described copper as “the new oil” because of its vital role in clean energy technologies.
In 2023, the IMF projected a 66% increase in copper demand between 2020 and 2040, as the global transition away from oil continues to accelerate. The infographic below illustrates this shift, showing how copper demand is set to rise sharply while oil consumption is expected to decline.
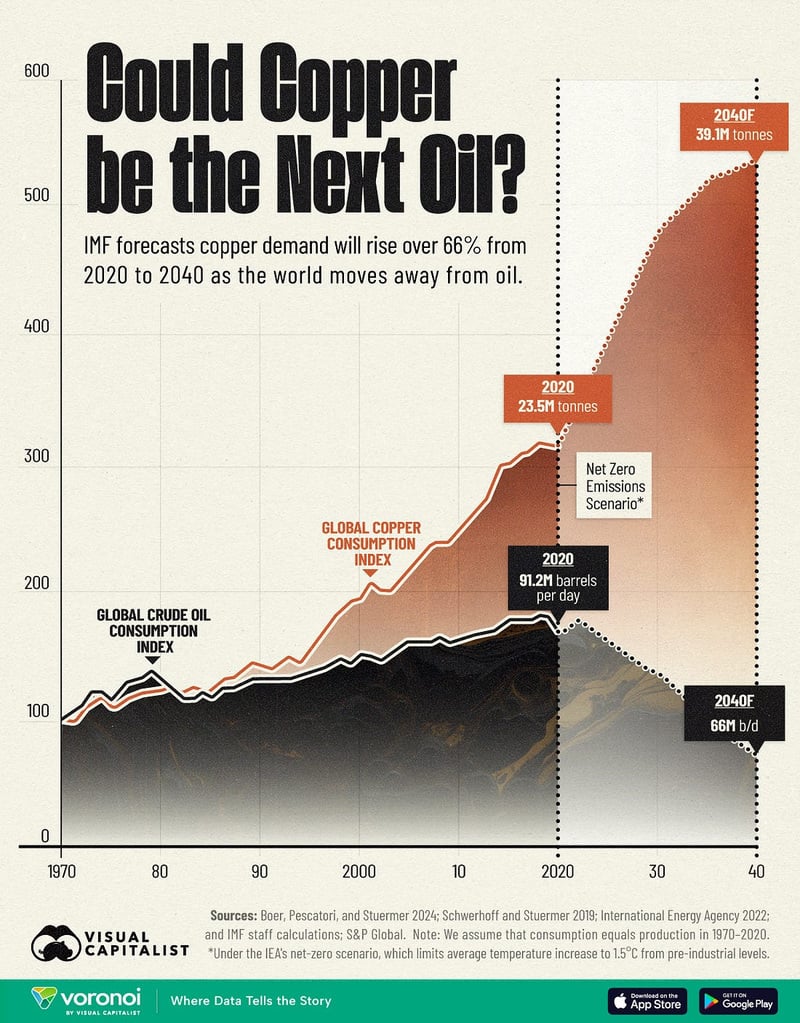
Copper plays a vital role in numerous applications, including the electrical grid, electric vehicles (EVs), and renewable energy technologies. In addition to its importance in clean energy, copper is widely used in sectors such as construction, infrastructure, and defense, thanks to its exceptional properties.
Under a net-zero emissions scenario aimed at limiting global temperature increases to 1.5°C above pre-industrial levels, global copper demand is expected to rise significantly, from 25.9 million tonnes in 2023 to 39.1 million tonnes by 2040.
A significant portion of this growth is anticipated to come from the electric vehicle industry, where copper is a critical component. Battery electric vehicles, on average, contain 60-83 kilograms of copper—four times the amount used in internal combustion engine vehicles, which typically require only 15-20 kilograms of copper per car.
In contrast, oil consumption is projected to decline significantly, falling from 101.9 million barrels per day in 2023 to 66 million barrels per day by 2040. This decrease is fueled by global efforts to cut carbon emissions, the rapid adoption of renewable energy, and advancements in energy efficiency. Stricter policy regulations are also playing a key role in reducing oil demand.
Last year, French billionaire and commodities trader Pierre Andurand predicted that copper prices could soar to $40,000 per tonne in the coming years—a nearly fourfold increase from the current price of $10,717 per tonne.
“We are moving towards a doubling of demand growth for copper due to the electrification of the world, including electric vehicles, solar panels, wind farms, but also military usage and data centres,” he told the Financial Times.
This bullish copper thesis is exciting news for investors who are open to investing in a variety of commodities beyond just gold and silver.
Even for those who prefer to stick with precious metals, a copper bull market should prove highly bullish for silver as well due to their close correlation and relationship. I’ve been ultra bullish on silver for the past two years, and I believe that silver has also recently begun a major bull market of its own, although with a bit of a lag compared to gold.
To wrap things up, for those who feel they missed the boat on the early stages of the gold and silver bull markets, even though both still have plenty of room to rise, I believe copper is the next metal poised to launch into a major bull market.
There are many reasons for this, including copper’s undervaluation relative to the money supply, gold, the U.S. national debt, and the stock market. In addition, copper has a strong demand outlook thanks to its essential role in a wide range of technologies, from AI to clean energy.
Considering all of these factors, I believe copper is the next big opportunity for those who are informed and willing to take the risk.
More By This Author:
Is Silver About To Crash Like In 1980 And 2011?
The Bullish Case For Palladium
Gold Isn't Going Up, Your Money's Just Losing Value
For the author's full disclosure policy, click here.


