
Copper Continues To Look Weak Despite The Recent Bounce
The daily chart for copper is another which has some key volume price analysis lessons and examples, and as I suggested in a post several weeks ago, this commodity was looking weak and so it has proved to be in the fullness of time, and the sequence I want to focus on here is the price action of August and in particular over the last couple of weeks.
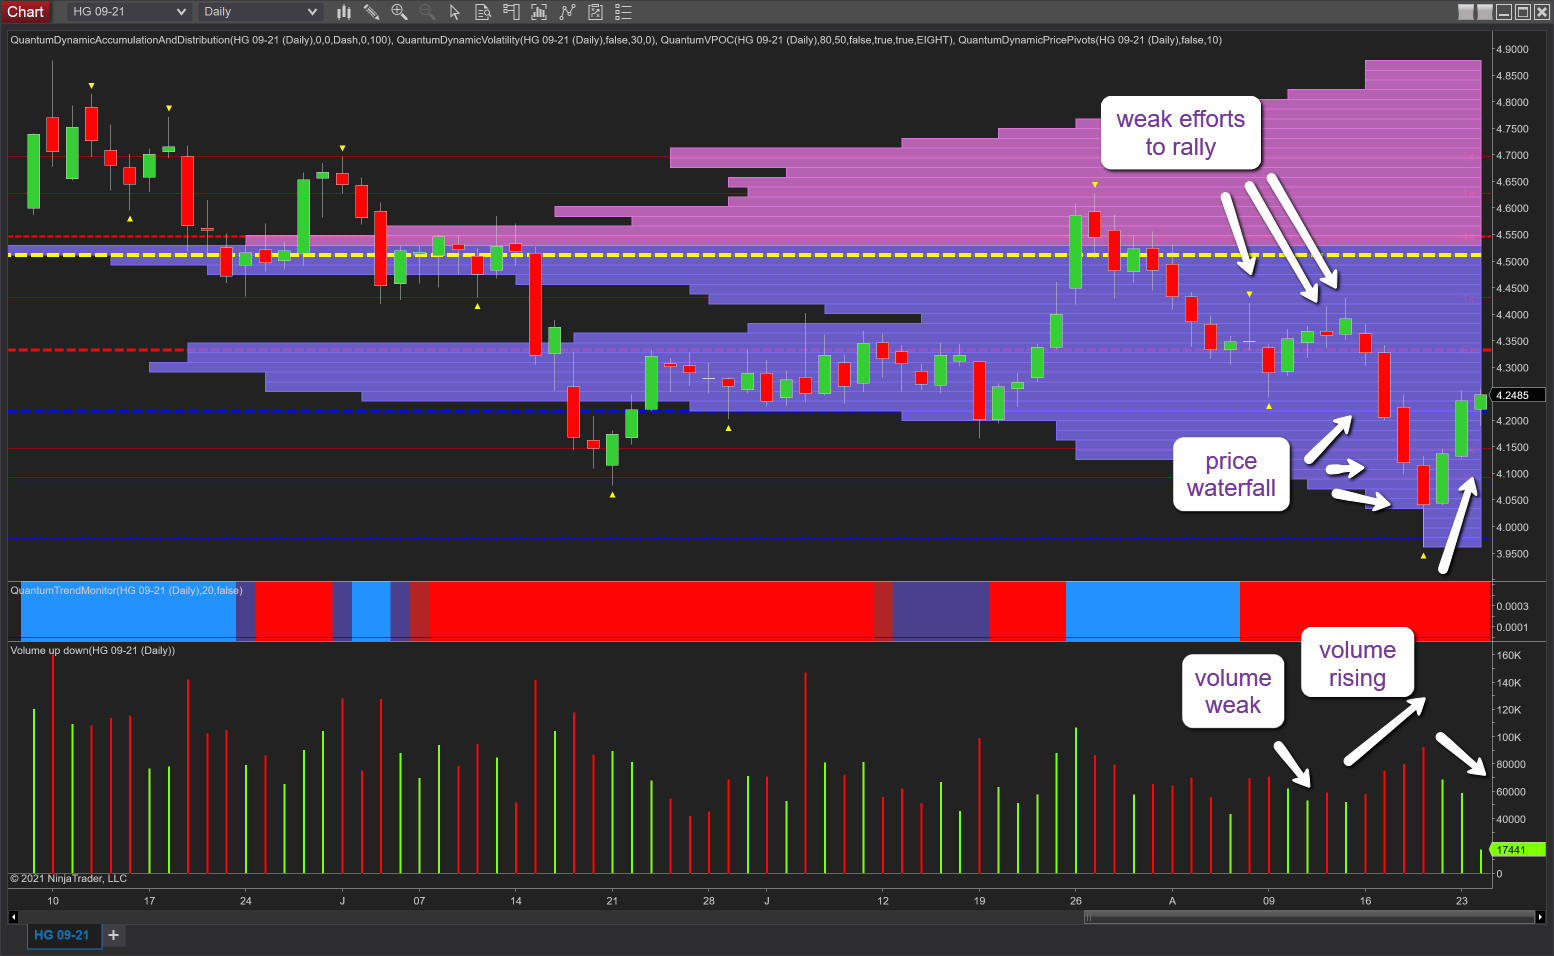
If we begin with the initial move away from the volume point of control denoted with the yellow dashed line, note the feeble attempts to rally around the $4.35 lbs area with volume falling, narrow-bodied candles, and wicks to their upper bodies, surely not a sign of a strong market. And so it proved to be with the price action developing into a classic waterfall with widening spreads on rising volume. In a falling market, this is what we always want to see, rising volume which confirms the big operators are selling heavily and is, therefore, a genuine move lower. The big operators then step in and buy around the $4.00 lbs level and the day closes with a nice deep wick to the lower body and a reversal the following day. Overlay these two candles and you have a strong hammer. However, notice yesterday’s volume, it is lower than the previous day, and simply becomes a pause point in a series of lower highs and lower lows in the downwards path. This lack of significant volume is something we are also seeing in the ongoing bounce higher in the indices which too may run out of steam.
(Click on image to enlarge)
Disclaimer: Futures, stocks, and spot currency trading have large potential rewards, but also large potential risk. You must be aware of the risks and be willing to accept them in order to invest in ...
more

