Are Higher Interest Rates Good For The Economy?

Image source: Pixabay
Interest rates surged last week on the back of a hotter-than-expected inflation report that wasn’t actually that bad (see below). Not that my – or your – opinion about these things matters all that much to the market. In the short run all that matters is what the majority believes is the truth. What they believed last week was that inflation isn’t falling fast enough and the Fed will not be cutting rates anytime soon. That was enough to send the bond market into a tizzy which impacted, well, everything. Stocks were down with small and midcaps taking it worse than large caps. Real estate was down but wasn’t the worst performing sector as financials, materials and healthcare all fared worse. Commodities and crude oil were down even with the Middle East bracing for more conflict between Iran and Israel. Gold did manage to post a small gain but that isn’t a positive even though we own it (see more on gold and the dollar below).
The rise in rates last week pushed the 10 year to its highest level since the peak at 5% in October of last year. The 10 year yield rose 19 basis points on Wednesday when the CPI report was released but by the end of the week was “only” up 11 basis points. The short term trend is obviously up and depending on how you define it, so is the intermediate term. Rates have been rising with only temporary interruptions since August of 2020 but the rise accelerated in March of 2022 when the Fed started to hike rates. Since March 8th, 2022 the 10 year Treasury rate is up 264 basis points. But why? Inflation? I think that’s what a lot of people would say or they might say the rate rise is tied to expectations about Fed policy, i.e. fear of the Fed raising rates more. But that is essentially saying the same thing, isn’t it? Why else would the Fed raise rates except if inflation doesn’t fall?
There’s a big problem with that interpretation though, mainly that inflation expectations haven’t been rising and even last week’s rise can’t really be blamed on inflation fears. How do we know? Because since the Fed started to hike rates in the spring of 2022, real rates have actually risen more than nominal rates. When nominal rates first started to rise in August of 2020, inflation expectations were around 1.5% for the 10 year breakeven rate. Inflation expectations rose along with nominal rates until the Fed started to hike, with the 10 year breakeven inflation rate hitting 3.02% on April 21, 2022, right after the Fed’s first hike in March. But since then, the nominal 10 year yield has risen 160 basis points while the 10 year TIPS yield has risen by 224. Since the Fed started raising rates, long term inflation expectations have fallen by 64 basis points. Last week’s CPI release didn’t change that. After the report the 10 year TIPS yield rose 15 basis points. By the end of the week TIPS yields were up 10 basis points, 1 basis point different from the nominal bond; despite a “hot” inflation report, inflation expectations didn’t change. Which means the rise in rates last week was almost all about real growth expectations, not inflation.
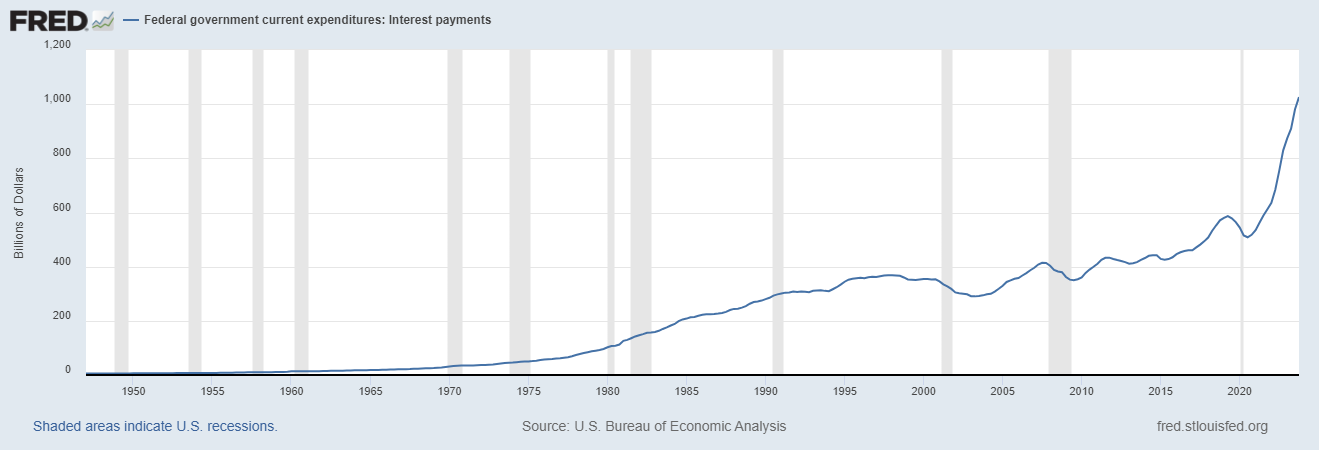
What that implies is intriguing to say the least. The implication of the CPI report is that the Fed’s rate cuts will be delayed, that rates will stay “higher for longer”. Why would that cause a rise in real growth expectations? One reason might be this:
(Click on image to enlarge)
That’s Federal Government current expenditures on interest payments. There’s been a lot of pixels spent explaining why that’s bad from the perspective of the government but almost none spent on looking at it from another perspective. The government paying out more interest may have a deleterious effect on the federal budget but it is a boon to whoever is on the receiving end. Interest expense is up a cool half trillion dollars since the onset of COVID which is a lot of cheddar for somebody. Yes, some of it is going to foreign governments, including China, but holdings by foreigners actually peaked in 2021 and have been falling pretty steadily since. The Federal Reserve also isn’t getting any of this rise in interest payments since they are actually reducing their ownership of Treasuries (QT). So, where are the new Treasuries and all that interest going?
(Click on image to enlarge)
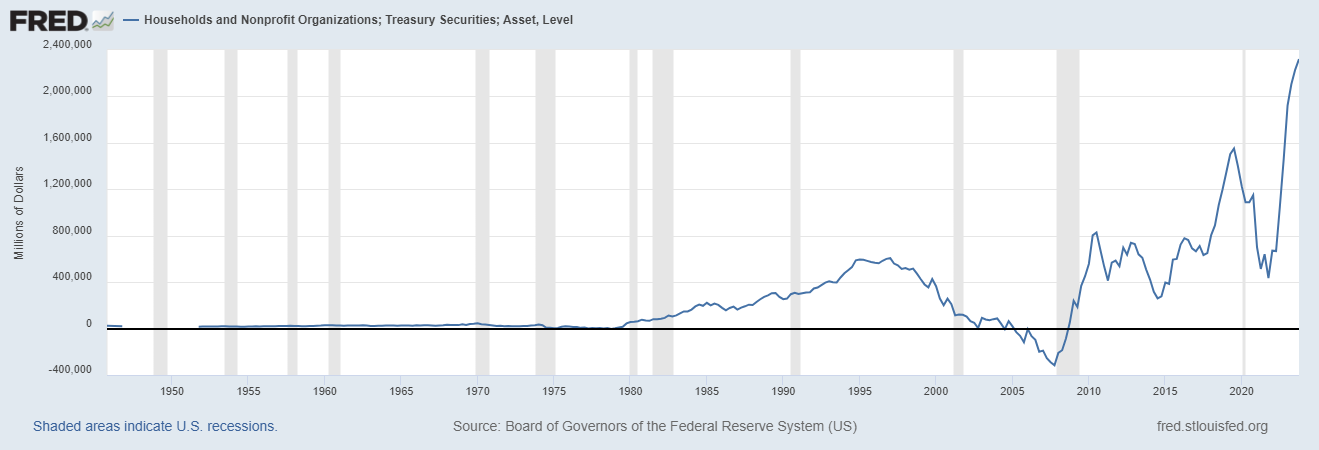
Holdings of Treasury Securities by households and nonprofits has risen from $435 billion in Q4 2021, right before the Fed started hiking rates, to $2.3 trillion in Q4 2023. If we dig into the Personal Income report we find that annualized personal interest income is up $288 billion since the end of 2021 so a lot of this interest paid out by the federal government is going straight to the bottom line of personal income. Lower interest rates would obviously be good for borrowers. The market seems more interested in the impact of higher rates on lenders.
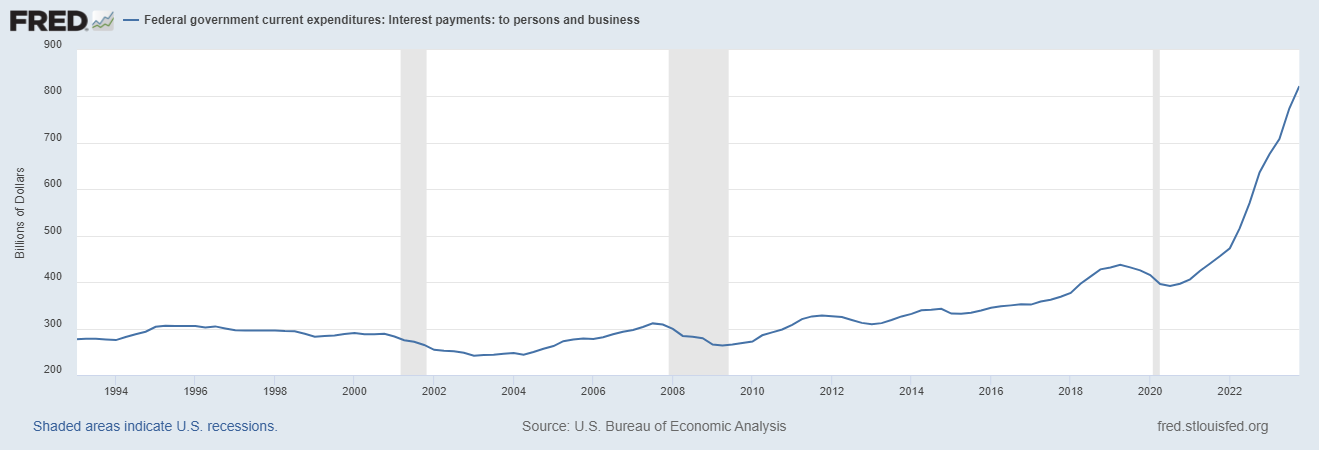
The market appears to believe that a cut in interest rates would reduce real growth, rather than raise it as most everyone assumes. The market could be wrong about the impact of this post-COVID interest income windfall but that is the obvious conclusion. Since the Fed started hiking rates interest income has risen more than interest payments but the difference doesn’t seem like a lot at roughly $37 billion. But how that new income is distributed could make a big difference. And the personal income rise doesn’t take into account the income to corporations which are sitting on near records amounts of cash. Maybe there’s a reason the stocks of large companies with lots of cash are among the most resilient in the market. Federal government interest payments to persons and business are up an annualized $366.5 billion since the end of 2021:
(Click on image to enlarge)
If higher interest rates are now positive for real economic growth – and maybe there’s a limit to that where if rates get too high, the debt burden hurts the economy more than the income helps – that is just one more way the post-COVID economy is different than the one we had before the pandemic.
There are a lot of things happening in markets today that don’t conform with the norms of the last 40 years. Gold prices, for instance, are rising to a new record at the same time real interest rates and the dollar are rising which is the opposite of what we usually expect. Why? Good question and I don’t know for sure but I think the impact of those increased interest payments may be part of the answer. See below for more on gold but first a little more depth on the inflation picture.
Inflation
The Consumer Price Index (CPI) data for March, released on Wednesday last week, was higher than expected but the difference was actually pretty minor. The month to month change in the previous month’s release (February data) was reported as 0.4% which was the fourth straight month of acceleration in the month to month change. The market was hoping to see a lower sequential change with expectations for the headline and core CPI readings for March of 0.3%. The actual release showed a change of 0.4% and bonds reacted very negatively with the 2 year Treasury rate rising 23 basis points and the 10 year 19 basis points. Expectations for Fed rate cuts were pushed from June to September, at the earliest. Those are large moves in rates for one day and the impact on other assets was severe. Stocks were down of course, but the real losers were anything interest rate sensitive. REITs fell 4% on the day, high dividend stocks were down over 2%, financials were down nearly 2% that day and nearly 4% for the week. The S&P 500 fell less than 1% the day of the release and, as I write this on Friday, is down just 1.3% for the week. Small and mid cap stocks were down a little more but the real story is that stocks in general took the inflation reading in stride.
If we look at the actual data rather than relying on headlines, we get a less dire picture of the month to month change in the inflation rate. The February change in the CPI from January was actually +0.44206% which was rounded down to +0.4% for the press release. The change from February to March – the data released last week – showed a change of +0.37807%, which was rounded up to +0.4% for the press release. If the market was hoping the March reading would fall 0.1% from February (0.4% vs 0.3%), then the result was almost as expected. Instead of falling 0.1% the actual change was 0.06399%. If the actual result had been 0.02808% lower, it would have been rounded down to 0.3%. Would everyone have been happy with that result? I have no idea but my guess is yes which means bond yields had a huge move based on basically nothing.
The real message here is that investors shouldn’t be making long term decisions based on one economic data release. Does anyone really believe that the monthly inflation rate falling 0.06% instead of 0.1% really makes any difference? Does anyone really believe that the Bureau of Labor Statistics can measure the change in the inflation rate on a monthly basis to four decimal places? Have you interacted with a government agency recently? The inflation rate, assuming the BLS numbers are anywhere close to accurate, is gradually falling since the monthly peak in June of 2022. No, it isn’t falling in a straight line to the 2% target and if it was I’d be suspicious of the data. The real world just doesn’t work that way. And the first quarter of the year seems an especially silly time to be drawing any long term conclusions about inflation. How many companies make salary and pricing decisions at the beginning of the year? All of them?
The Fed updated its Summary of Economic Projections at last month’s FOMC meeting so their expectations are available to anyone who takes the time to read them (see here). Anyone who believes the CPI report last week changed their view of the economy should follow that link. First of all you won’t find any reference to the Consumer Price Index because that isn’t the measure the Fed uses for inflation. They use the Personal Consumption Expenditure measure of inflation which is currently a lot lower than the CPI. The year over year change in the PCE deflator was 2.5% in February vs 3.2% for the February CPI (the March yoy change was 3.5% and no you shouldn’t panic about that either). The Fed’s own projections don’t see much improvement in that measure for 2024 with a median expectation of 2.4% by the end of the year. The median expectation of the members contributing to the SEP is for PCE inflation to hit the 2% target in 2026. Yes, 2026.
Markets don’t move on reality; markets move on perception. Traders today don’t have any time to parse the data before acting. In most cases, the trading is driven by algorithms that are trained to react to headlines, which is why you get days like last Wednesday. It takes investors with a longer term focus to bring markets back to reality – when they can. Ultimately a lot of what happens day to day in markets is nothing more than noise because it is based on data that is flawed or misinterpreted. But the moves generated by noise are real nonetheless and can cause investors to overreact, to make errors and push markets to further extremes. It works in both directions but we only think of it as an error when it is to the downside. Bond yields probably fell too much after peaking in October last year based on false expectations about future Fed policy. That in turn pushed up interest sensitive sectors like REITs and stocks too much based on the reality of the inflation situation. Will the market now move too far in the opposite direction? Probably because that’s the way markets work these days.
Gold
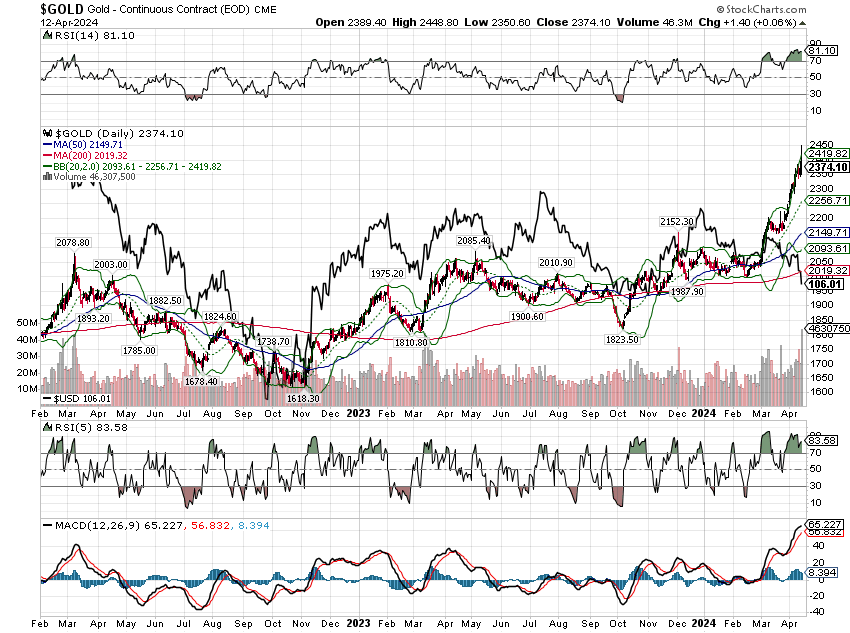
Gold has been setting new highs, trading above $2400 at one point on Friday before succumbing to some profit taking. The odd thing about the rise is that gold prices are usually inversely correlated to the dollar (dollar down, gold up) and the dollar has been rising of late. Gold is also inversely correlated with real interest rates (real rates down, gold up and vice versa) and real rates have been rising right along with gold prices. Another thing in the post-COVID era that seems completely out of sync with how we came to expect things over the last 40 years. Why is this happening? One convenient explanation has been worries about war in the Middle East (and other places I suppose) since both the dollar and gold are considered safe havens. That’s certainly possible and coincides with a rise in oil that has also been blamed on Middle East tensions. But there are other reasons to expect gold to rise and ultimately for the dollar to fall. Gold may just be telegraphing a future move in the dollar.
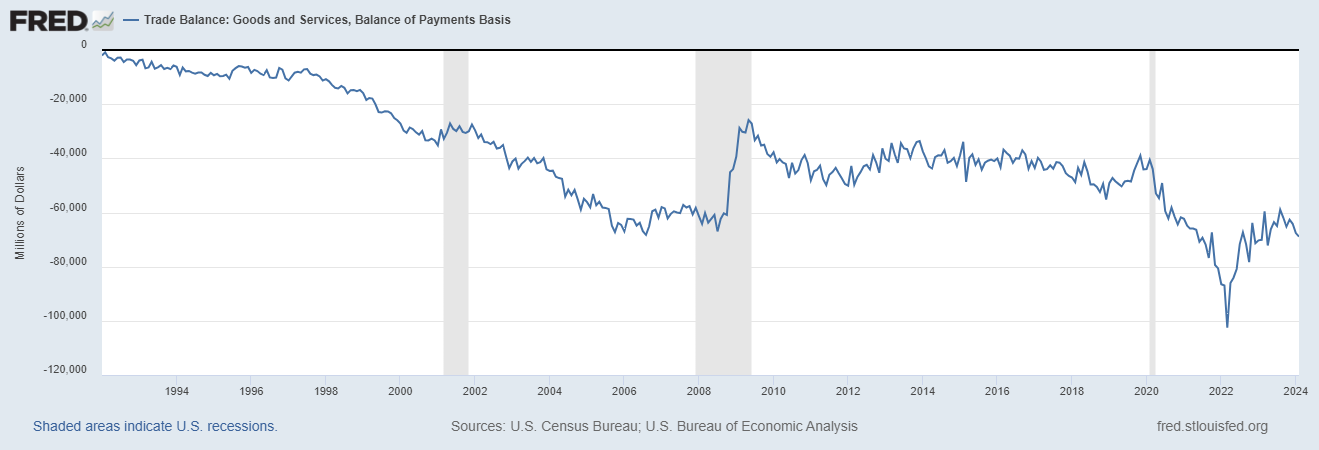
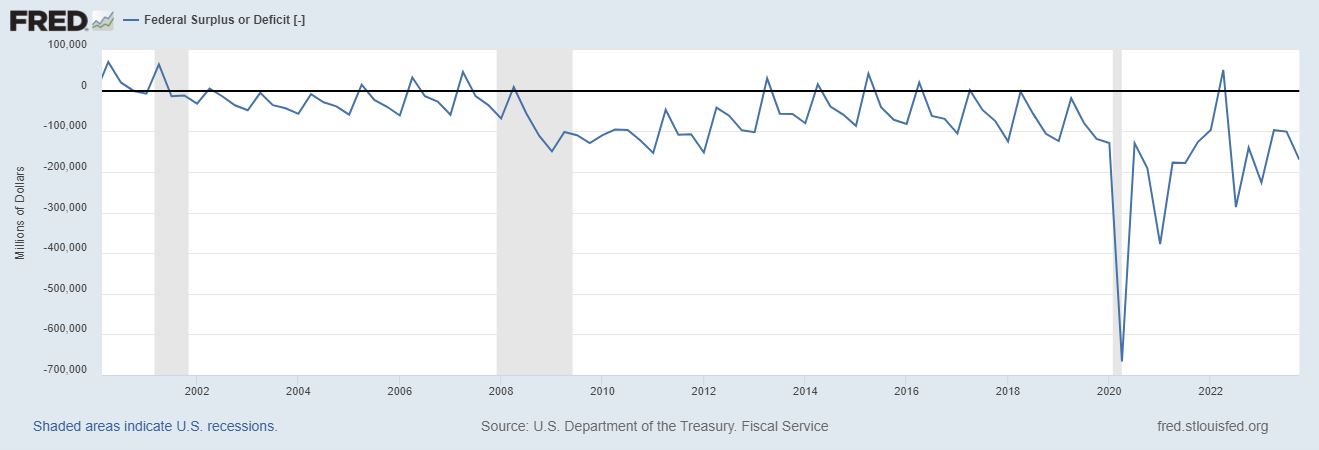
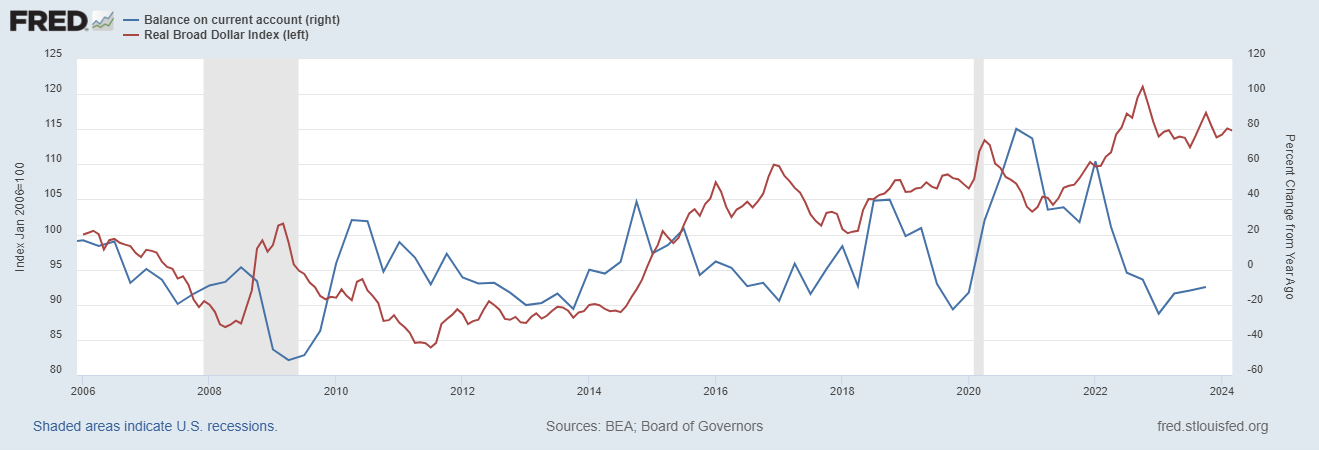
The value of the dollar is influenced by changes in the US Current Account which is, in turn, driven primarily by the trade and budget balances. As the trade and budget deficits get worse, the current account deficit also worsens. A worsening current account deficit essentially means there is more money going out of the country than coming in and that has historically put pressure on the currency of the deficit nation. Both the trade and budget deficits are, once again, starting to grow. In the case of trade it is due to rising goods consumption and leaner inventories, the same reason we’re starting to see factory activity pick up. In the case of the budget deficit, it is the increased interest payments, among other things. The improvement seen in 2022 and 2023 appears to be over.
(Click on image to enlarge)
(Click on image to enlarge)
The current account data for the first quarter will likely confirm its deterioration as well. In the meantime, the dollar looks a lot like Wile E. Coyote running off the cliff:
(Click on image to enlarge)
For the dollar and gold to get back in sync, either the dollar or gold will have to fall. It could be both or either but given the current account situation, I would think the dollar would be the bigger mover.
The solid black line is the dollar index inverted.
(Click on image to enlarge)
If that is what happens, if the dollar plays catch up to gold, the implications for portfolios are significant. Commodities and gold have their best returns, by far, when the dollar is falling while international stocks tend to outperform domestic US stocks. Emerging markets perform particularly well. Real estate also performs well but it is more sensitive to interest rates.
Maybe this is just Middle East jitters and everything will return to normal soon. Or maybe the conflict between Israel and Iran really does escalate. Or maybe our deficit chickens finally come home to roost.
Environment
(Click on image to enlarge)
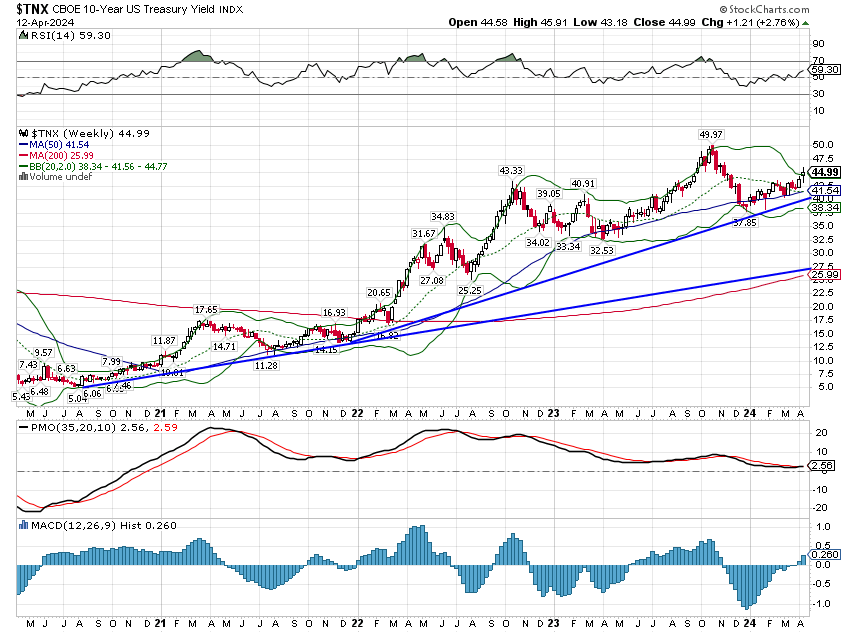
10 year yields broke out of the channel they had been in for the last 18 months to the upside. The 10 year rate is in a short to intermediate term uptrend and I think we have to be prepared for the rate to test the 5% level set last October. Next week’s economic releases will be scrutinized for any economic weakness with data on retail sales, two Fed regional manufacturing surveys, industrial production and housing. We also get an update on the Leading Economic Indicators.
I think the real question about rates is whether this is just a cyclical rise or if the secular trend has changed. If it is the latter – and I’m definitely leaning that way – it will necessitate a change in our strategic allocation. That isn’t something we do lightly so we need to be sure but it may become necessary.
(Click on image to enlarge)
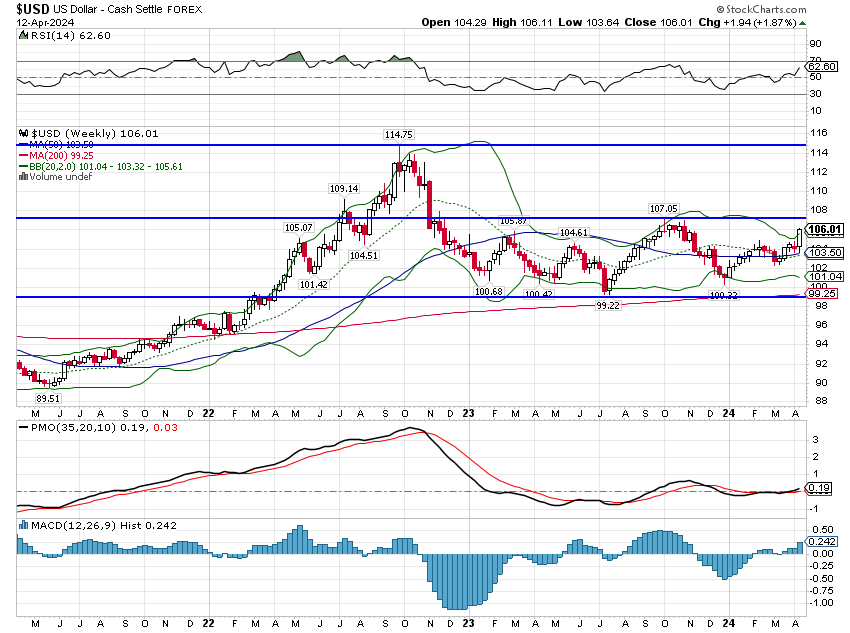
The dollar is also in a very short term uptrend since the beginning of the year but did not break out of the range it has been in since late 2022. The short term target is obviously the 107 peak last year. As I explained above, I think there are good reasons to expect the dollar to trade lower in coming years because of our budget and trade deficits. But the world is not always that logical and the dollar, despite all our government debt, is still a safe haven. And there are lots of reasons to want one of those right now. For now the short term trend is up and that’s all we really know.
(Click on image to enlarge)
Markets
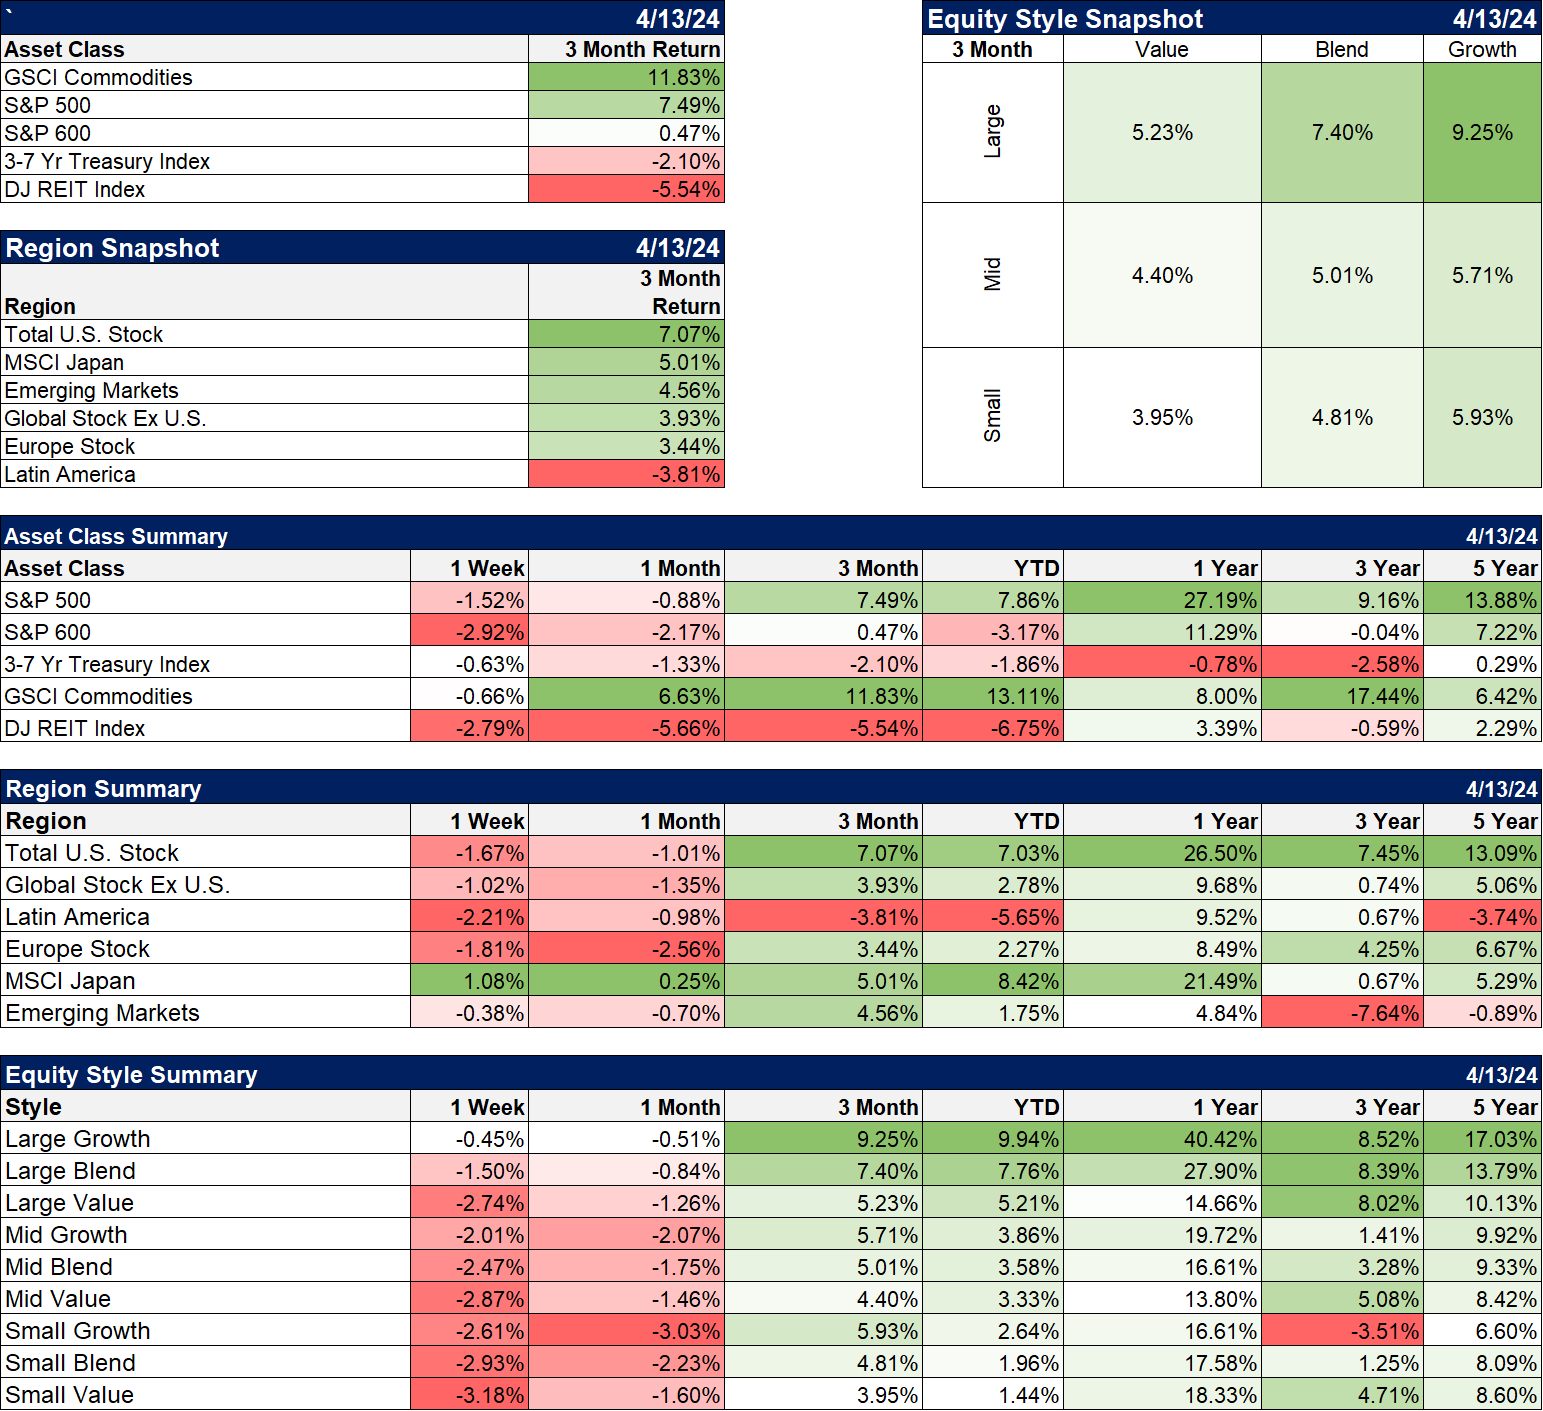
Year to date, the gainers are down to Large Cap and commodities. Small cap (S&P 600), intermediate Treasuries and REITs are all down for the year. More amazingly, the same applies to three year returns, with only large cap stocks and commodities higher. I don’t have the numbers available right now but I’d guess that is a pretty rare occurrence. I’ll report back later in the week.
(Click on image to enlarge)
Sectors
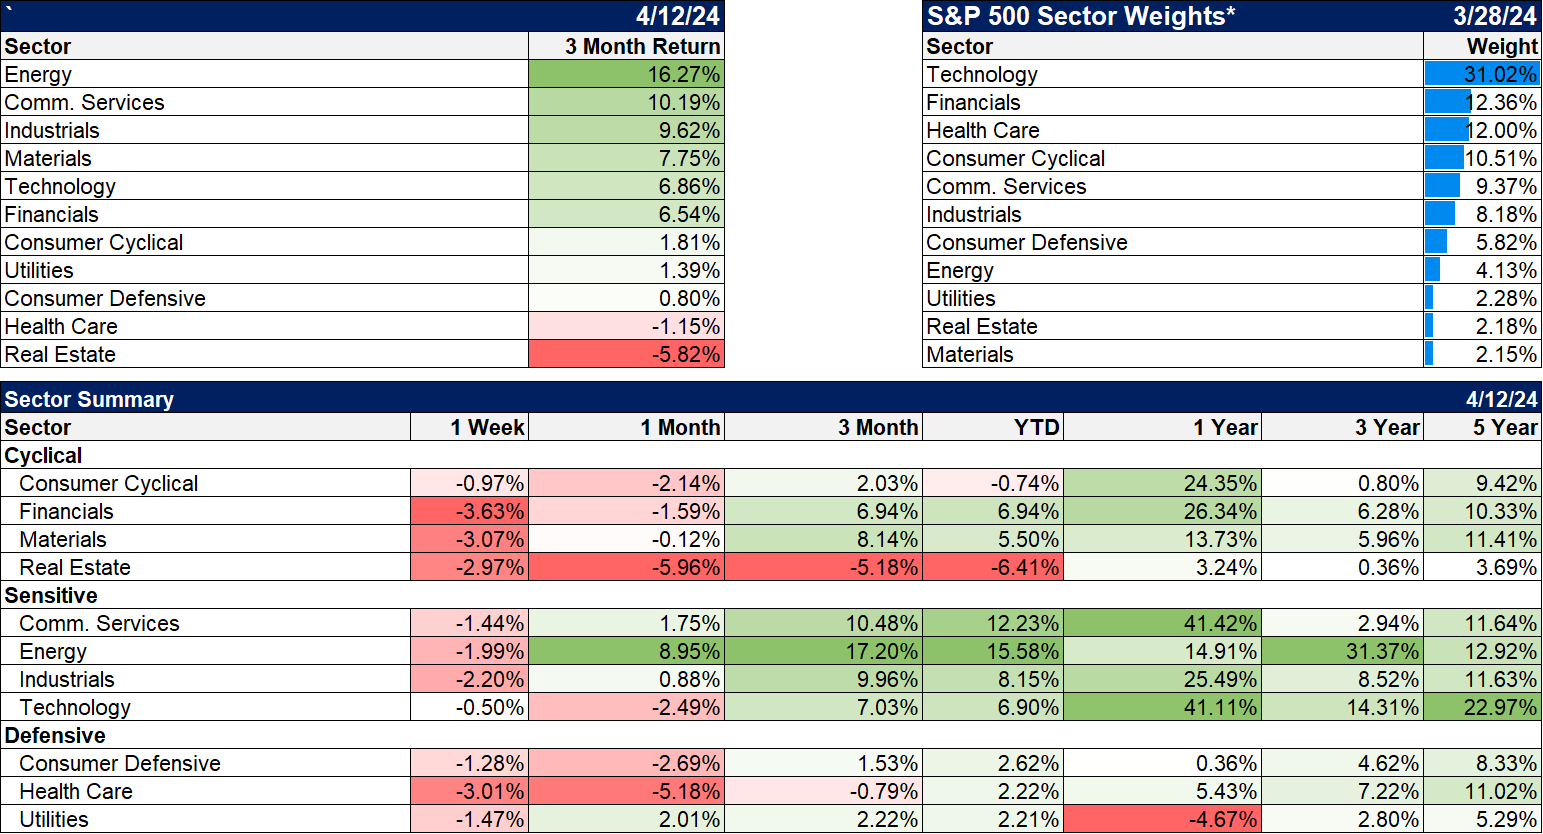
Every sector was lower last week with financials the hardest hit. YTD still sees energy in the lead with Communication Services close behind. REITs and consumer cyclicals are down on the year.
(Click on image to enlarge)
Market/Economic Indicators
Rates were higher across the board but credit spreads remain well behaved.
Last week’s economic data that wasn’t about inflation:
- NFIB Small Business Optimism Index which needs to be retitled to the Small Business Pessimism index. Hit the lowest level since 2012 which sounds really bad but if you don’t remember the recession of 2012 or 2013 or 2014 or 2015 or 2016 or 2017 or 2018 or 2019 that’s because there wasn’t one. I’m not sure what this index is good for but it isn’t worth a darn as an economic indicator.
- Redbook Index – This measure of same store sales rose to 5.4% last week. It hit its nadir in the summer of last year when it turned negative for a few weeks but it has been rising steadily since then.
- Initial jobless claims fell to 211k. Jobs market remains strong
- Export and Import prices up 0.3% and 0.4% respectively. YOY change is -1.4% and +0.4%. Not exactly hot and one more reason why you really shouldn’t pay much attention to the CPI
- University of Michigan Consumer Sentiment fell a bit in the April preliminary reading to 77.9 from 79.4 in March. This has basically flatlined this year and is still up from last year’s readings in the 60s and low 70s. This one is only slightly more useful than the NFIB survey.
(Click on image to enlarge)
More By This Author:
Market Morsel: Cash And Carry
Weekly Market Pulse: A New Paradigm?
Weekly Market Pulse: Rational Exuberance?
Disclosure: This material has been distributed for informational purposes only. It is the opinion of the author and should not be considered as investment advice or a recommendation of any ...
more
