
KaraGrubis
Inverted yield and the economy
An inverted yield curve occurs when the yields on long-term bonds are lower than the yields on short-term bonds of the same credit quality. This phenomenon is often seen as an indicator of an economic recession or slowdown in the near future.
The reason why an inverted yield curve is considered a potential signal of a recession is that it indicates investors are pessimistic about the future. Normally, investors require higher yields on long-term bonds as compensation for the additional risk of holding those bonds for a more extended period. However, when short-term yields are higher than long-term yields, it suggests that investors believe that the economy will weaken in the future, causing interest rates to decline.
When the economy is in a recession, central banks tend to lower short-term interest rates to stimulate economic activity. However, when the yield curve is inverted, the central bank's ability to use monetary policy to stimulate the economy is limited because they can only lower short-term rates so far before they reach zero. This situation is known as the zero lower bound, and it can lead to a situation where monetary policy is ineffective in stimulating the economy.
In summary, an inverted yield curve can indicate that a recession is likely to occur in the future, which can limit the effectiveness of monetary policy in stimulating economic activity. This situation can lead to a period of economic weakness or even a recession.
Gold and Silver prices and inverted yield curve
An inverted yield curve can also have an impact on the price of gold and silver, as they are often considered safe-haven assets during times of economic uncertainty.
When investors become more risk-averse and are concerned about a potential economic slowdown, they may turn to gold and silver as a store of value. As a result, the demand for these metals can increase, leading to an increase in their prices.
Furthermore, an inverted yield curve can lead to a decline in the value of the currency, particularly the currency of the country where the yield curve is inverted. A weaker currency can make gold and silver more attractive to investors, as they are often priced in U.S. dollars. This can also contribute to an increase in their prices.
Historically, gold has tended to perform well during periods of an inverted yield curve, as it is often seen as a safe-haven asset during times of economic uncertainty.
One example of this occurred during the Global Financial Crisis in 2008 when the yield curve inverted. Gold prices rose significantly during this time, as investors turned to the metal as a hedge against the economic uncertainty and financial instability.
Another example was during the period of the late 1970s to early 1980s, when the U.S. experienced multiple inverted yield curve episodes. During this time, gold prices rose significantly due to concerns about inflation, a weakening U.S. dollar, and geopolitical risks.
In summary, an inverted yield curve can lead to an increase in demand for gold and silver as safe-haven assets during times of economic uncertainty, potentially leading to an increase in their prices. However, the relationship between an inverted yield curve and the prices of these metals can be complex and is subject to various other factors.
Price of Gold since 2020
Since the beginning of 2020, gold has had a volatile performance due to the impact of the COVID-19 pandemic and other economic and geopolitical factors.
In the first few months of 2020, as the pandemic began to spread globally, gold prices rose significantly as investors sought safety in the metal during a time of uncertainty. By August 2020, gold prices had reached an all-time high of around $2,070 per ounce.
However, after this peak, gold prices began to decline, as investors became more optimistic about the global economic recovery and moved towards riskier assets such as stocks. The rollout of vaccines and the easing of pandemic-related restrictions also contributed to this trend.
Gold prices continued to be volatile throughout 2021, responding to various economic and geopolitical events. For example, in the first half of 2021, gold prices fell due to rising U.S. Treasury yields and concerns about inflation. However, in the second half of 2021, gold prices rose again, as concerns about the Delta variant of the COVID-19 virus and the potential for new economic restrictions caused investors to seek safety in the metal once again.
As of March 2023, gold prices remain relatively high, with fluctuations in response to various global events and economic indicators.
In summary, gold prices have been volatile since 2020, responding to a range of economic and geopolitical factors. While gold prices have fluctuated throughout this period, they remain relatively high compared to historical averages.
Let’s take a look at the weekly prize of gold levels and standard deviation report we published in Marketplace on March 12, 2023, in order to capture any short-term trading opportunities.
Summary
- The weekly trend momentum of 1886 is bearish.
- The weekly VC PMI of 1851 is bullish price momentum.
- A close below 1851 stop, negates this bullishness neutral.
- If short, take profits 1822-1790., If long, take profits 1889 - 1912
- Next cycle due date is 3.15.23.
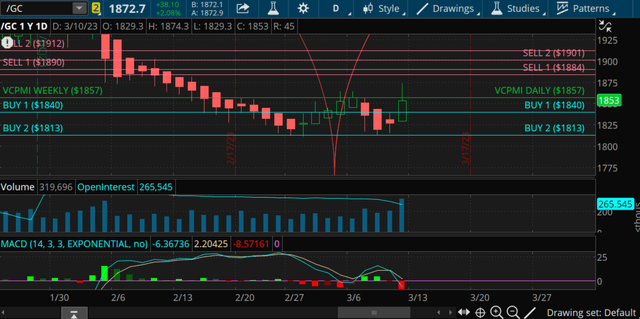
gold weekly (TOS)
Gold Weekly Trend Momentum:
The gold futures contract closed at 1867, below the 9-day SMA of 1886. This confirms that the weekly trend momentum is bearish. The current bearish momentum suggests that traders should be cautious about initiating long positions. A close above the 9-day SMA would negate the bearish short-term trend, and the trend would become neutral. Traders should monitor the market closely and consider taking short positions if the market continues to trend lower.
Gold Weekly Price Momentum:
The gold futures market closed above the VC Weekly Price Momentum Indicator at 1851, which confirms that the price momentum is bullish. This suggests that traders should consider initiating long positions in gold. However, a close below the VC PMI would negate the bullish short-term trend, and the trend would become neutral. Traders should monitor the market closely and consider taking profits if the market shows signs of reversing.
Gold Weekly Price Indicator Report:
Our strategy for the week is as follows: if short, take profits at 1822 - 1790, and if long, take profits at 1889 - 1912. This strategy is based on the current standard deviation levels and the expected price movements in the market. Traders should adjust their positions based on their risk tolerance and market conditions.
The next cycle due date for gold is 3.15.23, and traders should be aware of this date when making their trading decisions. The market could experience significant price movements around this date, and traders should adjust their positions accordingly.
Overall, the gold market is currently exhibiting mixed signals, with bearish short-term trend momentum and bullish price momentum. Traders should remain cautious and monitor the market closely to take advantage of any profitable trading opportunities.
More By This Author:
Retail Apocalypse: Gold And Silver Bottoms
Gold: A Race To The Bottom
'Everything Is Halted': Shanghai Shutdowns Are Worsening Shortages


Comments
Log in or sign up to join the conversation.