
A Triple Whammy For Gold: What Now?
Last week the precious market got a “Triple Whammy” of a silver duty hike in India, another rate hike from the Fed, and a blowout jobs report.
I urged gold, silver, and mining stock enthusiasts to be prepared for a significant price drop and to be even more prepared to buy it.
(Click on image to enlarge)
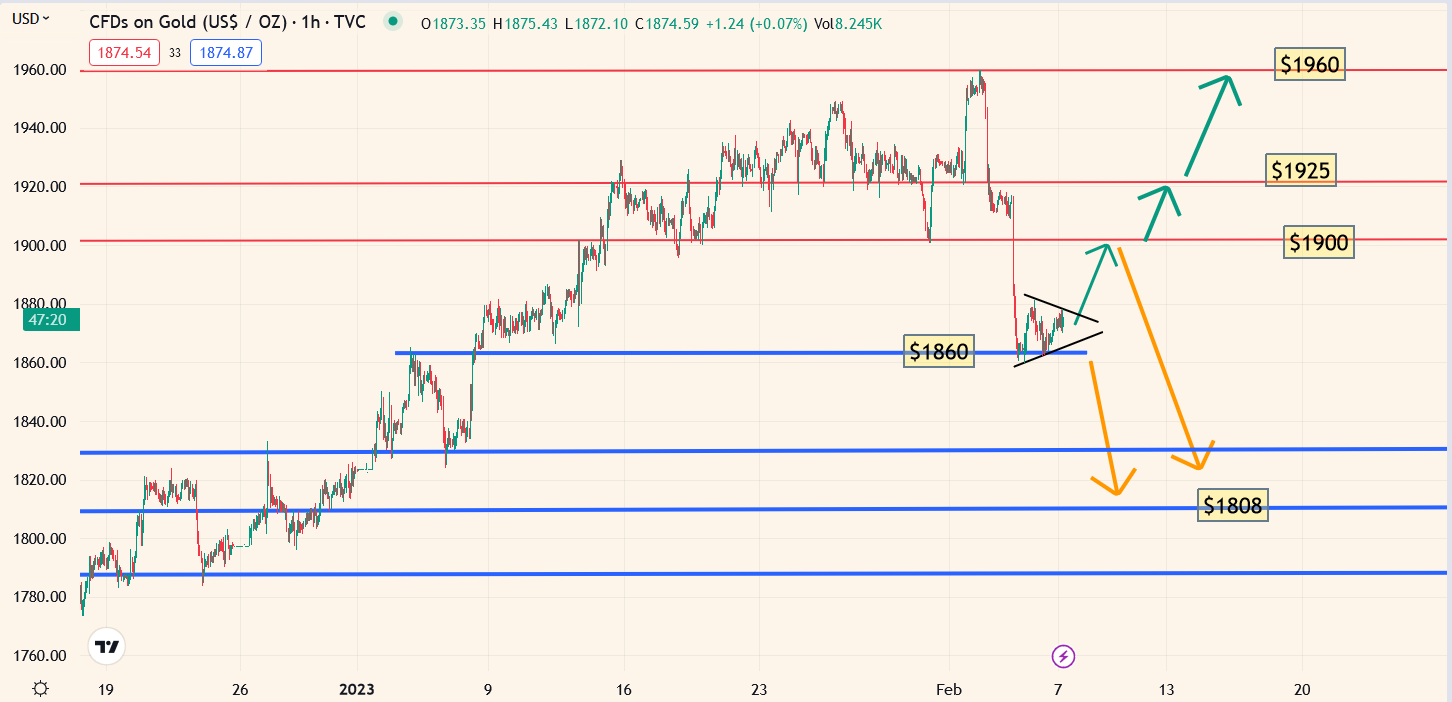
short-term gold chart.
The drop from $1960 was almost exactly $100/oz.
What about long-term investors, do they need to exercise caution at this point?
(Click on image to enlarge)
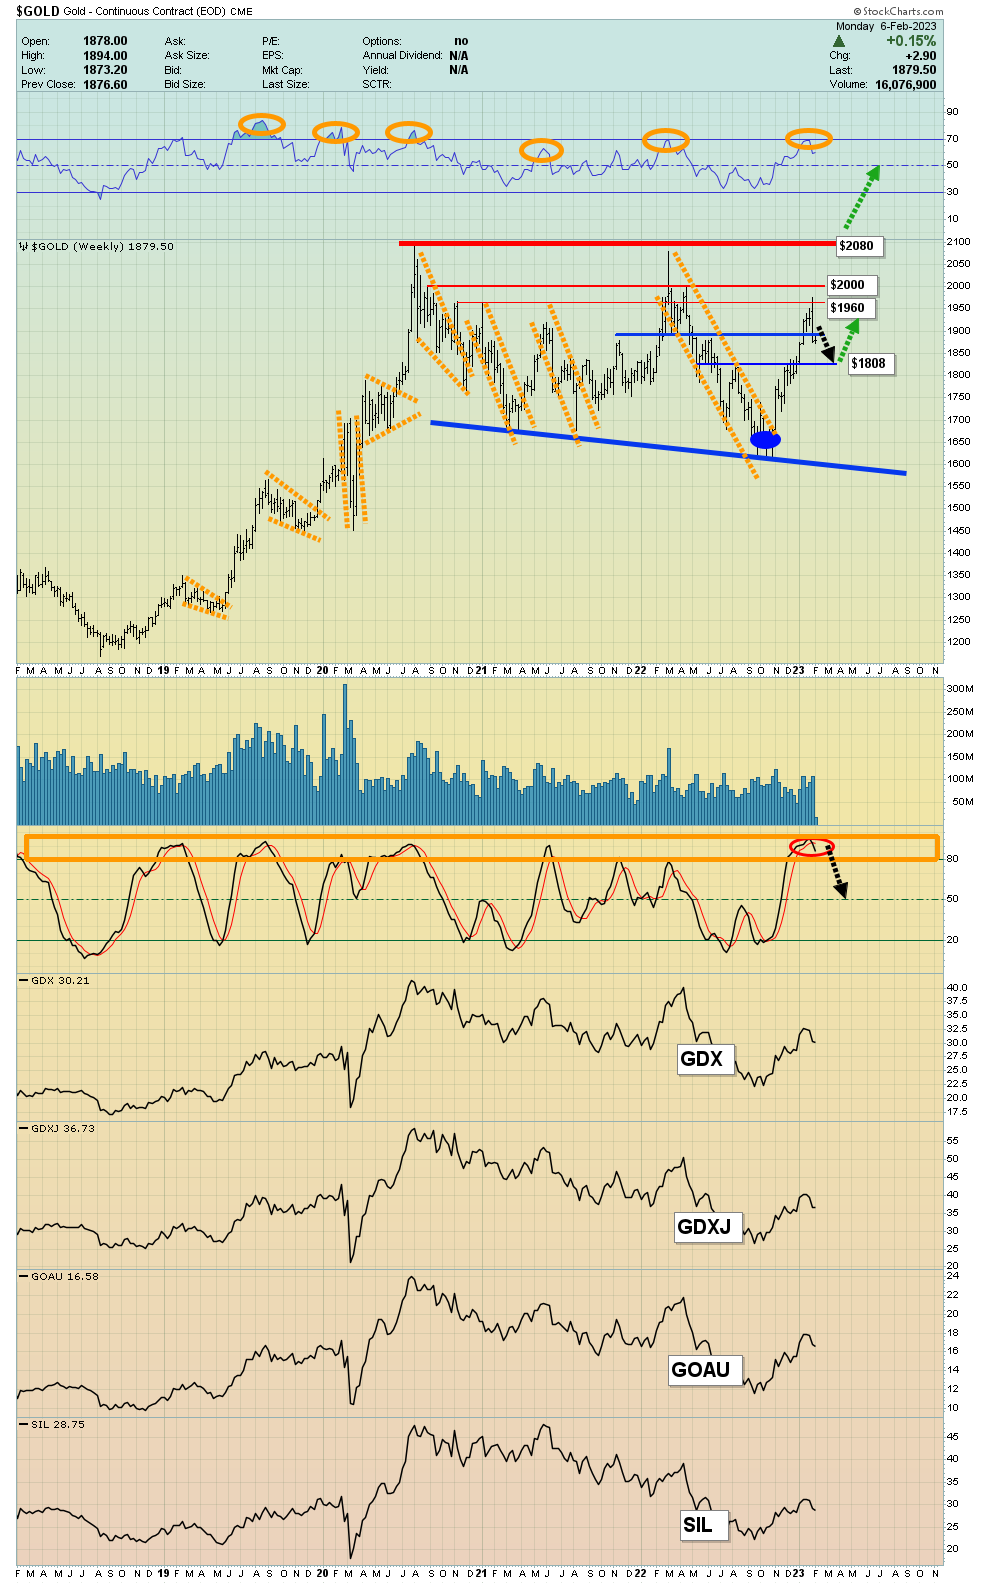
weekly gold chart.
The bottom line:
Investors don’t need to exercise caution because gold is both the ultimate currency and ultimate asset; all price sales are gifts and over time all fiat has an interesting history of… going to zero.
Having said that, patience is required. I use the 14,5,5 Stochastics series oscillator on the weekly chart because it tends to provide investors with a good balance of accuracy and volatility.
It’s massively overbought right now and while oscillators can stay overbought, the history of this oscillator suggests long-term investors will get their next big buying opportunity with the oscillator either at the momentum number of 50 or the oversold number of 20.
Short-term traders need to stop losses, put options or very small size. Long-term investors need only one thing: a good dose of patience.
My big focus for long-term investors (me included) is the $1808 buy-side HSR zone. HSR is horizontal support and resistance. The entire $1830-$1780 zone is essentially a giant buy zone for long-term investors.
(Click on image to enlarge)

daily chart for gold.
The man I consider to be the gold community’s foremost expert on moving averages, aka “Mister MA”… suggested I take a serious look at a number of key Fibonacci moving average numbers that he follows meticulously.
In my professional opinion, the 618MA on the daily chart is arguably the most stellar of them all. A pullback to the 618MA would occur at about $1820. That would be in perfect sync with the massive $1830-$1780 buy zone I’ve outlined for gold bugs of the world!
One caveat is that investors should never cheer for lower prices. That’s like cheering to get shot on the battlefield or punched in the face in a boxing ring.
My suggestion, for all gold bugs, is to cheer boisterously for $2080, $2200, and $2500… while doing serious preparation work to buy $1830-$1780 if a decline into that zone unfortunately happens.
What about the stock market and the current “Golden Cross” buy signal being flouted by the S&P500 technicians there?
(Click on image to enlarge)

The golden cross signal is the cross of the 200DMA by the 50DMA, and it’s finally in apparent play for the SP500… but it happens months after I issued my buy signal at the massive buy-side HSR zone of Dow 30,000. My focus was on the crypto sector there.
Gamblers and traders could buy the US stock market now, but that’s risky and I have my “crypto marines” (and myself) booking 50%-100% profits now. The golden cross signal for the SP500 is quite dangerous; it flashed a sell at the March 2020 lows while I issued a huge buy signal at Dow 18,300 there. The bottom line: a sell signal that comes at major market lows is not the kind of signal long-term investors should be taking without the use of serious risk management tools.
(Click on image to enlarge)
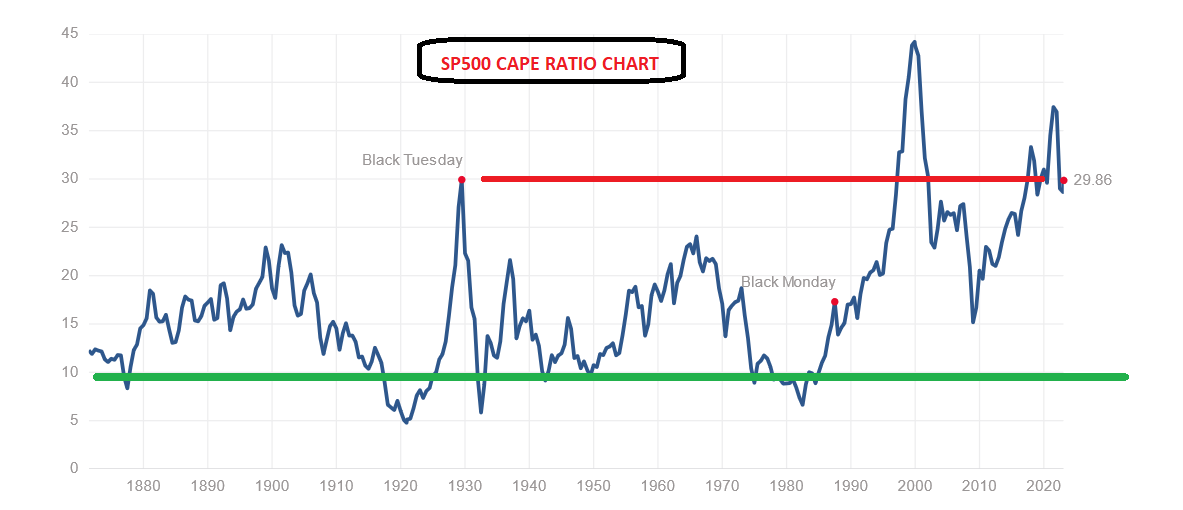
Valuation matters. This inflation-adjusted PE ratio chart shows the SP500 is in a state of what can only be viewed as… generational overvaluation.
The bottom line: The bullish golden cross signals for the US stock market are good for indicating that positions bought in the value zone could go higher. They are “ok” for gamblers. For long-term investors, the buy-signals should be accompanied by outstanding fundamental value, and that does not exist now.
What about oil?
(Click on image to enlarge)
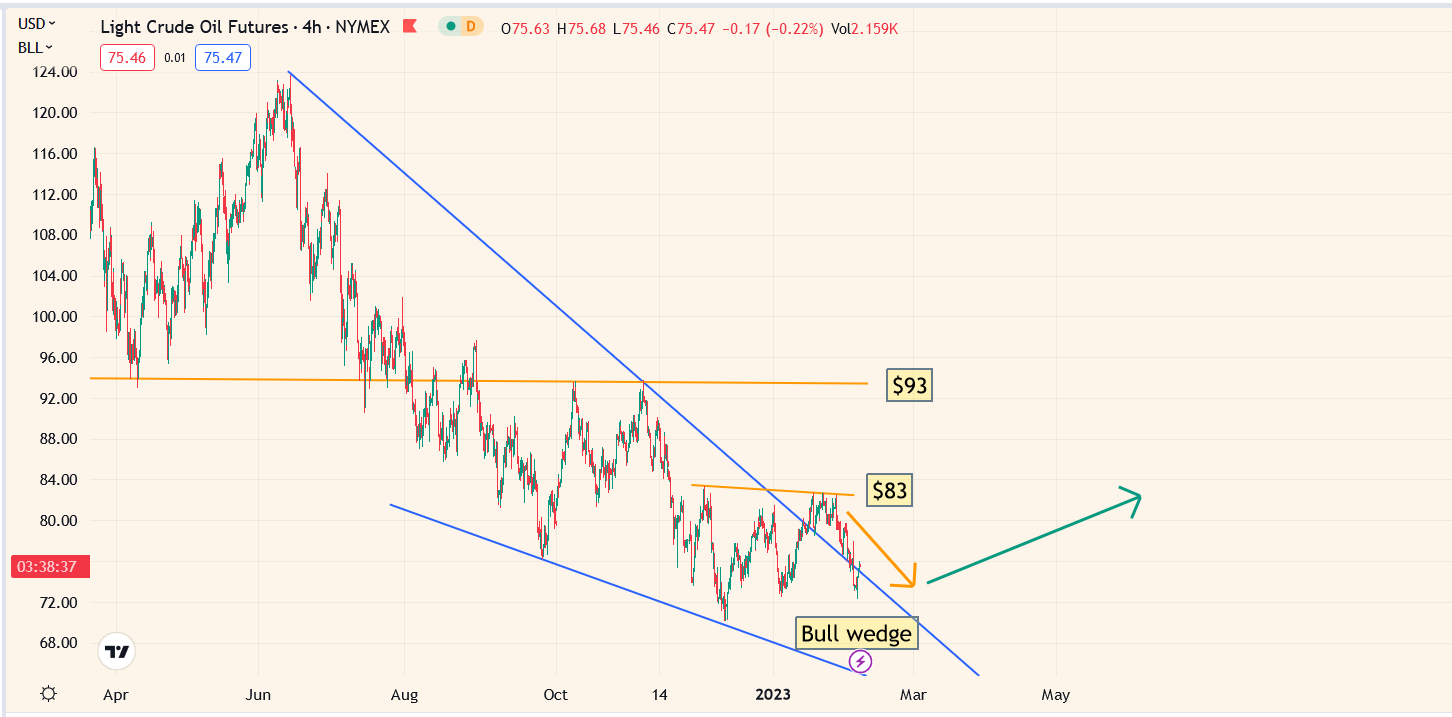
I highlighted a nice bull wedge for oil, but I also suggested that rather than an upside price “blastoff” from the breakout, there would be dismal price action first. That’s what happened, but I’ve issued buy signals for oil and oil stocks at $75/barrel, and I’ll issue more at $65. Oil is likely going much higher, but substantial investor patience is required. Here’s why:
The US government is led by a deranged draft dodger who appears to now envision himself as some kind of Patton 2.0 figure in his old age. Some gold bugs call him, “The American Caligula”. That’s obviously a concern.
In regards to oil: The US government’s warmongering in what’s left of Ukraine (and now Taiwan) requires the citizens to cheer the warmongering, and they won’t cheer at all if oil shoots to $200. The government is doing all it can to keep the price of oil low, and in the medium term, its efforts are incredibly successful.
In the long term, the commodity supercycle will re-assert itself and significant unrest could occur on the streets of America while oil roars toward $200 and gold to $3000. At that point, the American Caligula is going to have a major problem on his hands… with no solution other than violence against his own citizens.
(Click on image to enlarge)
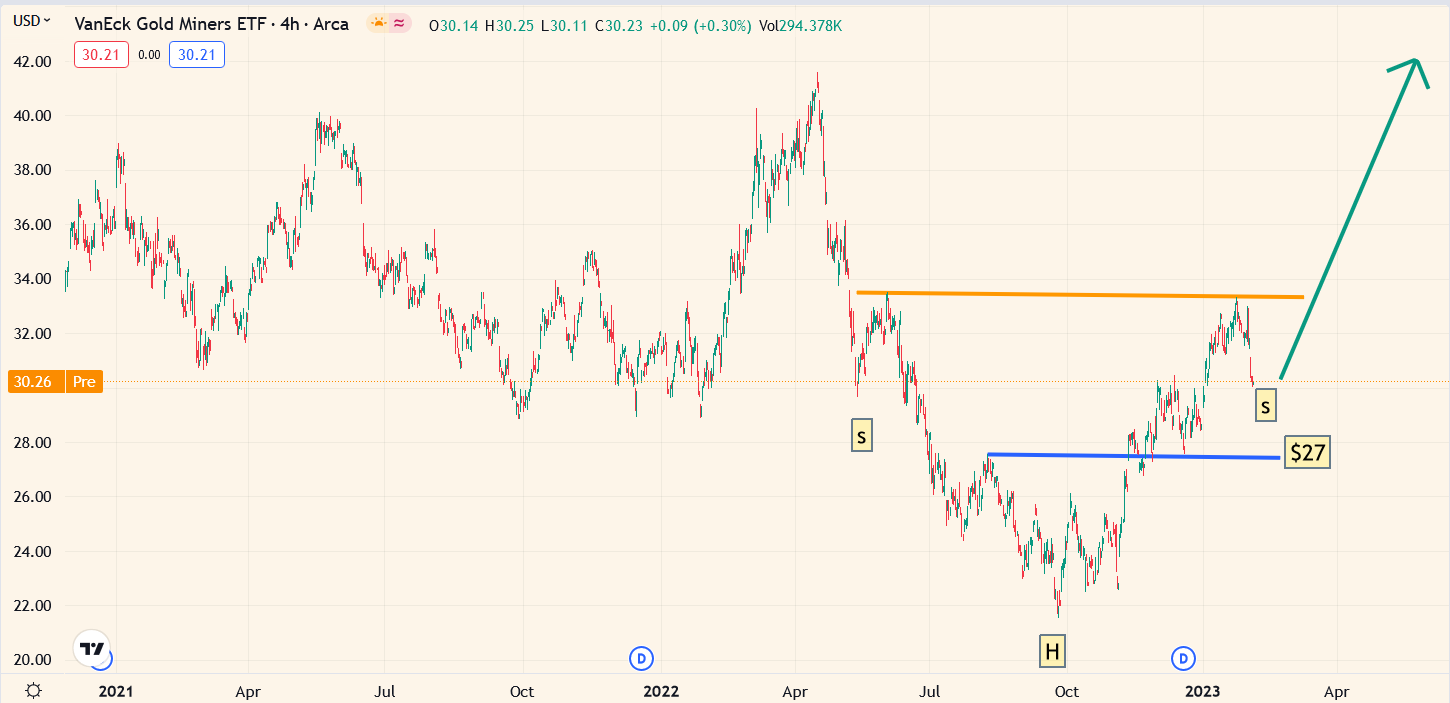
GDX chart.
Eager gold stock investors may want to buy some miners right now, while others may want to see if gold trades at my massive buy zone of $1830-$1780. If that happens, GDX would likely be trading at about $27.
A nice inverse H&S pattern has formed, and the target is “up in the sky”, at about $46! Exciting times are here. The stock market is for gamblers, crypto is for traders, and the miners are perhaps best described as… all for one and one for all!
More By This Author:
Gold Prices For Action $1880 And $1808
Gold Stock Race Cars On A Bull Era Track
Gold At $1925: Key Investor Tactics


