

Image Source: Pexels
Personal income growth at +0.8% m/m vs +0.4% Bloomberg consensus, while consumption growth is +0.4% m/m vs 0.5% consensus. GDPNow adjusted for gold imports now at -0.5% q/q annualized. Michigan final expectations for March down 52.6 vs 54.2 consensus.
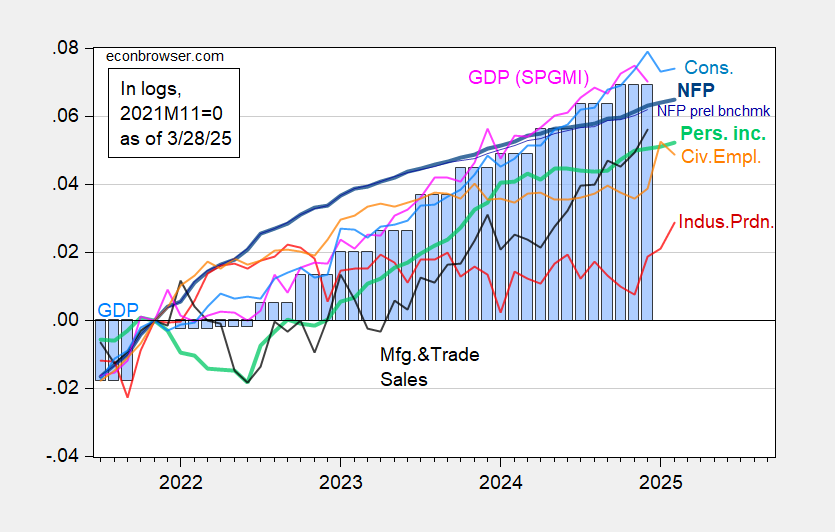
Figure 1: Nonfarm Payroll incl benchmark revision employment from CES (bold blue), implied NFP from preliminary benchmark through December (thin blue), civilian employment as reported (orange), industrial production (red), personal income excluding current transfers in Ch.2017$ (bold light green), manufacturing and trade sales in Ch.2017$ (black), consumption in Ch.2017$ (light blue), and monthly GDP in Ch.2017$ (pink), GDP (blue bars), all log normalized to 2021M11=0. Source: BLS via FRED, Federal Reserve, BEA 2024Q4 advance release, S&P Global Market Insights (nee Macroeconomic Advisers, IHS Markit) (3/3/2025 release), and author’s calculations.
Consumption numbers shift downward the nowcasts.
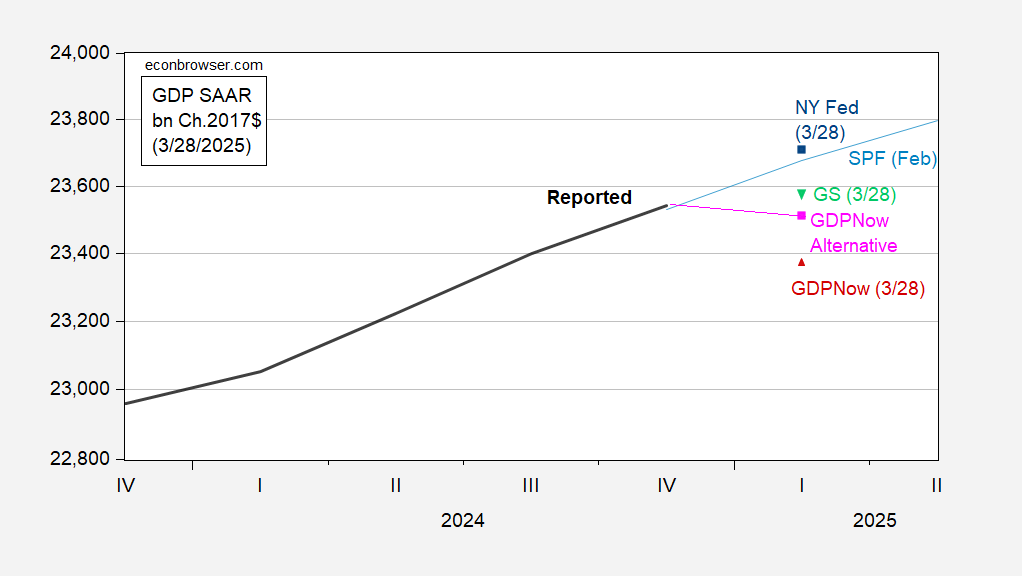
Figure 2: GDP (black), GDPNow of 3/28 (red triangle), GDPNow adjusted for gold imports (pink square), NY Fed of 3/28 (blue square), Goldman Sachs of 3/28 (inverted green triangle), February Survey of Professional Forecasters (light blue), all in billion Ch.2017$ SAAR. Source: BEA, Atlanta Fed, Philadelphia Fed, NY Fed, Goldman Sachs and authors calculations.
Expectations have fallen further in the final March numbers.
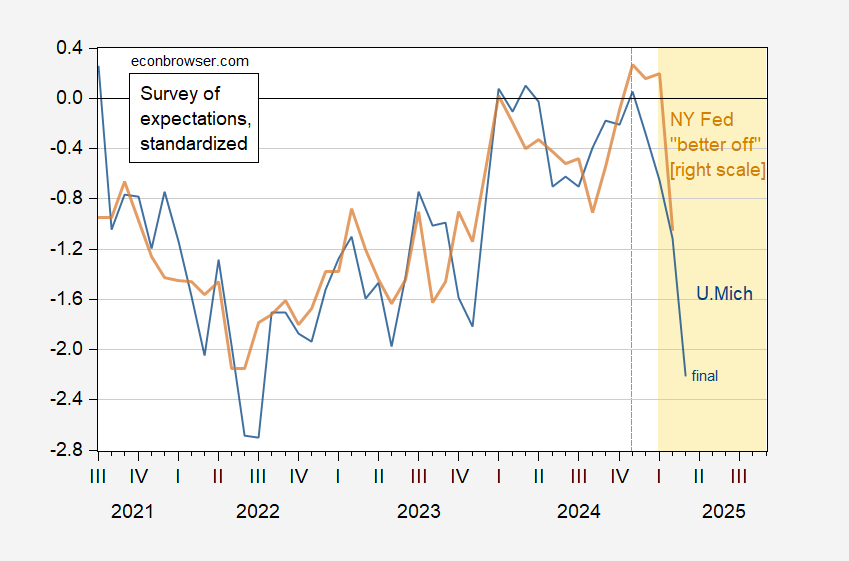
Figure 3: U.Michigan expectations index (blue), and NY “better off” aggregate (tan), both demeaned and standardized (2013M06-2025M02). Source: U.Michigan, NY Fed, and author’s calculations.
A decline in stock indices and term spreads is to be expected.
More By This Author:
2024Q4 GDP, GDO, GDP+, And Nowcasted Consumption CrashGDPNow Bouncing Near Zero
Conference Board: “US Consumer Confidence Tumbled Again In March”


Comments
Log in or sign up to join the conversation.