
Industrial and manufacturing production, and retail sales, all beating consensus. Nonetheless, there’s a tendency toward trending sideways.
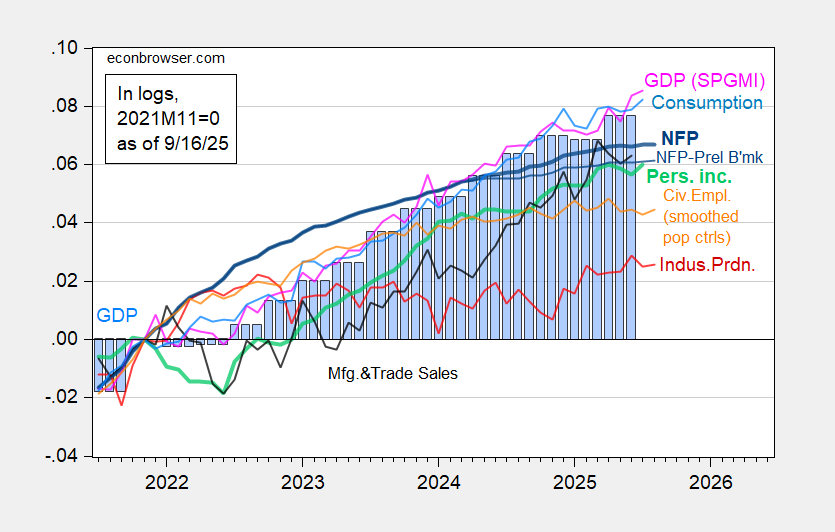
Figure 1: Nonfarm Payroll from CES (bold blue), NFP preliminary benchmark revision (blue), civilian employment with smoothed population controls (orange), industrial production (red), Bloomberg consensus industrial production of 8/14, (red square), personal income excluding current transfers in Ch.2017$ (bold light green), manufacturing and trade sales in Ch.2017$ (black), consumption in Ch.2017$ (light blue), and monthly GDP in Ch.2017$ (pink), GDP (blue bars), all log normalized to 2021M11=0. Source: BLS via FRED, Federal Reserve, BEA 2025Q2 second release, S&P Global Market Insights (nee Macroeconomic Advisers, IHS Markit) (9/2/2025 release), and author’s calculations.
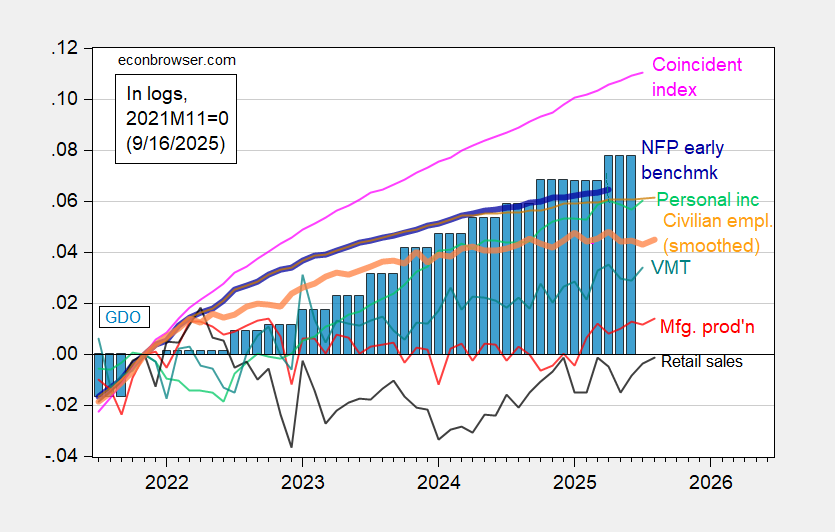
Figure 2: Implied Nonfarm Payroll early benchmark (NFP) (bold blue), civilian employment adjusted smoothed population controls (bold orange), manufacturing production (red), personal income excluding current transfers in Ch.2017$ (bold green), real retail sales (black), vehicle miles traveled (tan), and coincident index in Ch.2017$ (pink), GDO (blue bars), all log normalized to 2021M11=0. Retail sales deflated by chained CPI. Source: Philadelphia Fed [1], Philadelphia Fed [2], Federal Reserve via FRED, BEA 2025Q2 second release, and author’s calculations.
More By This Author:
The Danger Of Fed Credibility Under Assault
The Thanks Of A Grateful (Coffee-Drinking) Nation
CBO, CEA-OMB-Treasury, And SPF GDP Forecasts


Comments
Log in or sign up to join the conversation.