BTC/USD Forex Signal: Outlook As It Falls Below 200 EMA
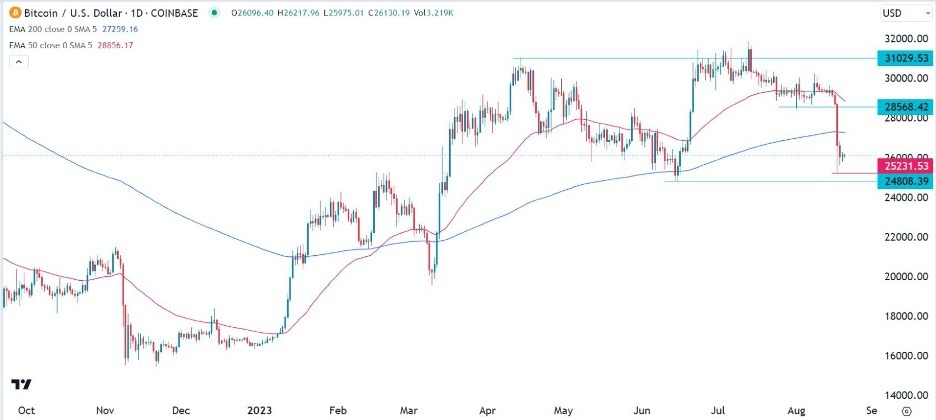
The daily chart shows that the BTC/USD pair formed a double-top pattern at the year-to-date high.
Bearish view
- Sell the BTC/USD pair and set a take-profit at 24,800.
- Add a stop-loss at 27,235 (200 EMA).
- Timeline: 1-2 days.
Bullish view
- Set a buy-stop at 26,500 and a take-profit at 27,500.
- Add a stop-loss at 25,000.
The BTC/USD pair made a strong bearish breakout, leading to Bitcoin’s worst week since the collapse of FTX in November last year. It plunged to a low of 25,231, the lowest level since June.
Rising fear in the market
Bitcoin’s crash came in a week when a sense of fear engulfed the financial market. The fear and greed index, which was in the extreme greed area of 80 a few weeks ago closed at 45 on Friday as it approached the fear zone.
There are a few causes of fear in the market. First, there are concerns about the Chinese economy as its growth fades. Official data showed that industrial production and fixed asset investments slowed in July. The country also stopped publishing youth unemployment numbers, signaling that the situation is getting worse.
Happenings in China are important for Bitcoin because of the volume of coins that people in the country are holding. While China has outlawed cryptocurrencies, there is evidence that many people still own Bitcoin.
Second, the BTC/USD pair as a sell-off spread across all assets. US stocks, including well-known brands like Tesla, Nvidia, and Apple have retreated in the past few weeks. Similarly, the bond market has also worsened, with US Treasury yields soaring to the highest level in more than a decade.
Third, there are concerns about the Federal Reserve. Analysts now believe that the bank will hike interest rates by another 0.25% in its September. If this happens, it will push them to the multi-decade high of 5.75% even as recession risks remain elevated.
Some crypto analysts believe that the BTC/USD sell-off was a shake-out, which happens ahead of a major rebound.
BTC/USD forecast
The daily chart shows that the BTC/USD pair formed a double-top pattern at the year-to-date high. The neckline of this pattern was at 24,808, a few points below its lowest level last week. As it dropped, Bitcoin flipped the important support at 28,568, which I wrote about here.
Bitcoin also retreated below the 200-day moving average. Therefore, the outlook for the pair is bearish, with the initial reference level being at 24,808. A break below that level will see more bears move in as they target 20,000.
(Click on image to enlarge)

(Click on image to enlarge)

More By This Author:
Gold Technical Analysis: Heading Towards Strong Support Levels
GBP/USD Technical Analysis - Attempts To Stop Losses
BTC/USD Forex Signal: Bitcoin Stuck In A Range As Sellers Eye $28,300
Disclosure: DailyForex will not be held liable for any loss or damage resulting from reliance on the information contained within this website including market news, analysis, trading signals ...
more


