GBP/USD Technical Analysis - Attempts To Stop Losses

Photo by Colin Watts on Unsplash
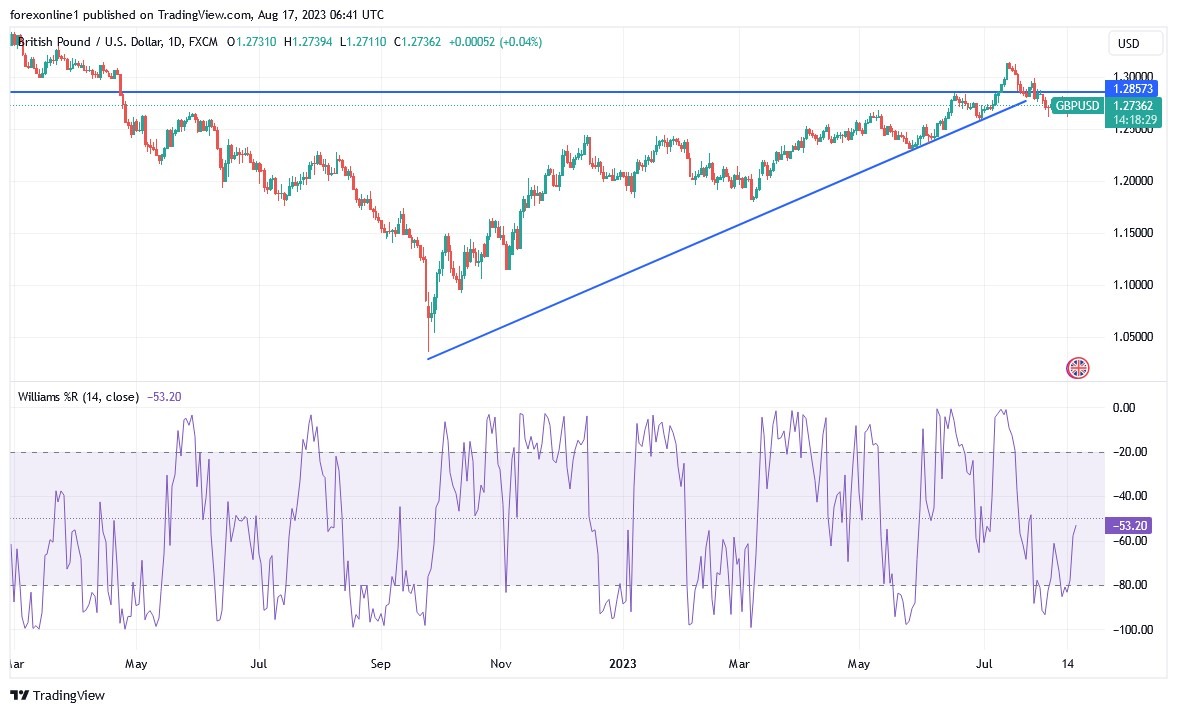
For three consecutive trading sessions, the price of the GBP/USD currency pair is trying to remain relatively stable after its recent losses. This affected the support level at 1.2616. The recent rebound gains did not exceed the level of 1.2766, before settling around the level of 1.2730 at the time of writing.
The general trend of the sterling currency pair against the dollar remains. GBP/USD is bearish and will not abandon it without returning to the vicinity of the psychological resistance of 1.3000 again. The last downward pressure came as the US dollar got a positive momentum from the content of the minutes of the last meeting of the US Federal Reserve Bank, during which it affirmed that the bank is determined to continue tightening until the record US inflation is contained.
Prior to that, the UK CPI for July outperformed the expected change (MoM) of -0.5% with a change of -0.4%. The equivalent (YoY) matched the expected change of 6.8%, down from the previous month's 7.9%. On the other hand, the core consumer price index for the month remained unchanged from the previous month at 6.9%, ahead of the expected rate of 6.8%. Seasonally adjusted core producer prices for July beat both forecasts (MoM) and (YoY) of -0.3% and 1.6% respectively with changes of 0.1% and 2.3%.
Technical analysis of the British pound against the dollar:
- The GBP/USD price has now declined to trade near the 100-hour moving average line.
- However, the currency pair still appears to have more room to run before entering the fully bearish territory on the 14-hour RSI.
- In the near term, according to the performance on the hourly chart, it appears that the GBP/USD is trading within a bearish channel formation.
- The MACD indicator has recently completed a bearish cross which indicates a short-term downtrend.
Therefore, the bears will be looking to extend the current decline towards 1.2702 or below to the support of 1.2674. On the other hand, the bulls will be looking to pounce on profits around 1.2757 or higher at the 1.2785 resistance.
In the long term, and according to the performance on the daily chart, it appears that the GBP/USD currency pair is also trading within a descending channel formation. However, the MACD indicator is indicating a possible reversal as it approaches a bullish crossover. Therefore, the bulls will be looking to pounce on potential retracements around 1.2846 or higher at 1.2989 resistance. On the other hand, the bears will target long-term profits at around 1.2606 or below the support at 1.2469.
(Click on image to enlarge)

More By This Author:
BTC/USD Forex Signal: Bitcoin Stuck In A Range As Sellers Eye $28,300
GBP/USD Forecast: Preparing for the UK Inflation Figures
BTC/USD Forex Signal: Sleeps As Crypto Winter Gets Underway
Disclosure: DailyForex will not be held liable for any loss or damage resulting from reliance on the information contained within this website including market news, analysis, trading signals ...
more


