BTC/USD Forex Signal: Bitcoin’s Double Top Pattern Points To More Downside
Bearish view
- Sell the BTC/USD pair and set a take-profit at 40,160.
- Add a stop-loss at 44,900.
- Timeline: 1-2 days.
Bullish view
- Buy the BTC/USD pair and set a take-profit at 44,200.
- Add a stop-loss at 40,000.
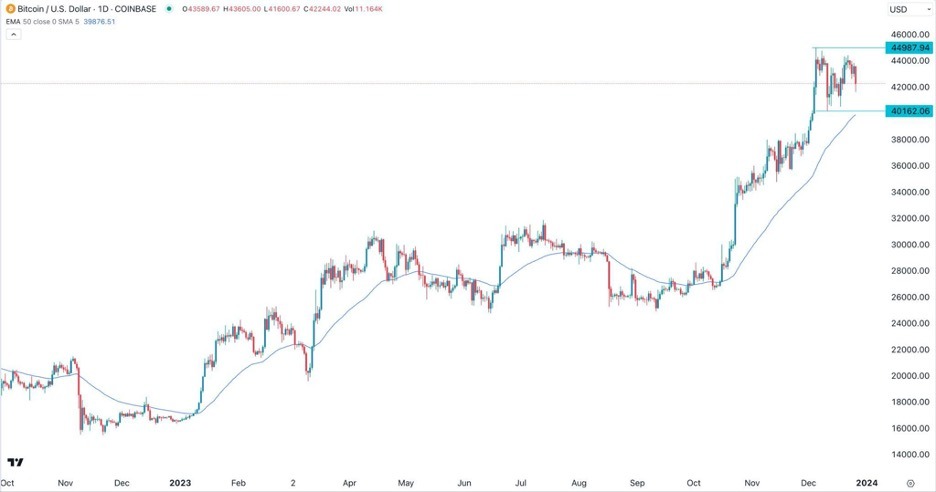
The BTC/USD pair retreated as the recent bull run lost momentum. Bitcoin pulled back to $42,000, which was a few points below the year-to-date high of near $45,000. Despite the pullback, it has still risen by more than 150% in 2023, outperforming key assets like the Dow Jones and the Nasdaq 100 index.
Low volumes and next catalyst
Bitcoin price pulled back in a relatively low-volume environment as the holiday season continued. Data compiled by CoinGecko and CoinMarketCap shows that most brokers had lower volume in the past few days.
Bitcoin also diverged from American equities as the Dow Jones, Nasdaq 100, and S&P 500 rose. Also, US bond yields continued falling, signaling that traders are optimistic that the Federal Reserve will start cutting rates in the coming months.
The Fed Rate Monitor tool shows that most economists believe that the first rate cut will happen in March. It also expects at least three more hikes in 2024 if inflation continues falling. Some analysts, including Cathie Wood, believe that the US could move into deflation.
Deflation is characterized by a reduction in product and service prices. While this is a good thing, it also sends the wrong signal about the economy. For example, consumers, who make up the biggest part of the economy could hold back spending hoping that prices will continue falling.
Bitcoin and other cryptocurrencies thrive in a period of low inflation and a dovish tone. For example, it surged to its highest level on record in 2021 as the Fed slashed interest rates and ramped up its QE program.
Bitcoin has also retreated as traders take a breather following a highly successful year. It started the year below $20,000 as concerns about the FTX collapse intensified. It then rallied as hopes of a spot Bitcoin ETF approval continued.
BTC/USD technical analysis
The daily chart shows that Bitcoin price has moved sideways in the past few days. While it remains above the 50-day moving average, it has also formed a double-top pattern. In most cases, this pattern is usually one of the most bearish signs in the market. Its neckline stands at $40,162.
Therefore, the outlook for the BTC/USD pair is bearish, with the initial support level to watch being at 40,162. This view will become invalid if the price reverses and moves above the year-to-date high of 44,987.
(Click on image to enlarge)

More By This Author:
EUR/USD Forex Signal: Bullish Outlook In A Thin Market
AUD/USD Forex Signal: A Rising Wedge Pattern Forms
BTC/USD Forex Signal: Bitcoin Wavers As Santa Rally Fades
Disclosure: DailyForex will not be held liable for any loss or damage resulting from reliance on the information contained within this website including market news, analysis, trading signals ...
more


I can't imagine actually taking a legitimate bet off of a potential double top. Crazy. This is why people lose so much. They think chart formations are a sure-fire indication of what is to come.
Bears have been getting burnt all year betting on chart formations.