BTC/USD Forex Signal: Bitcoin Wavers As Santa Rally Fades
Bearish view
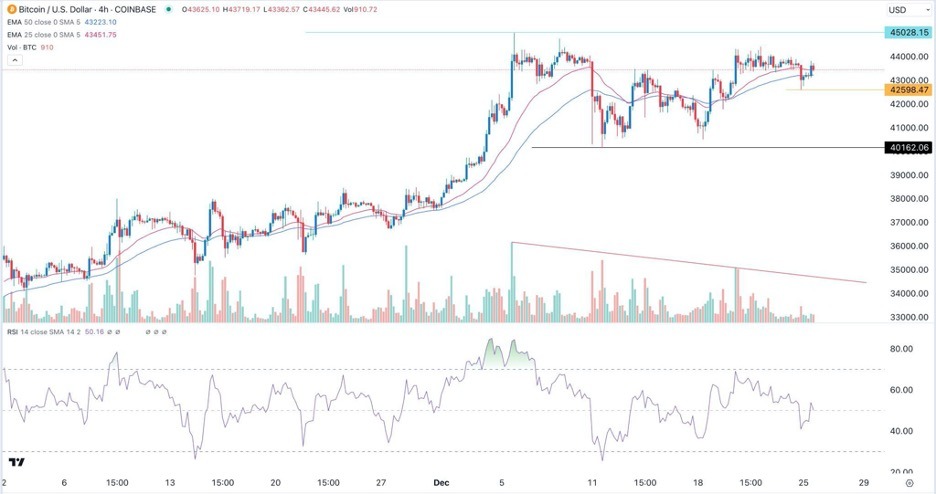
- Sell the BTC/USD pair and set a take-profit at 42,598.
- Add a stop-loss at 44,200.
- Timeline: 1-2 days.
Bullish view
- Set a buy-stop at 43,500 and a take-profit at 44,500.
- Add a stop-loss at 42,500.
Bitcoin (BITCOMP) price remained in a consolidation mood during the Christmas weekend as traders waited for the next big news. The BTC/USD pair was trading at 43,450 on Tuesday, where it has been in the past few weeks.

Bitcoin consolidation continues
The BTC/USD price has been in a tight range as volume remained much lower than the recent month’s average. This price movement was expected as most traders and investors went to holiday. Many big investors have also closed their offices until next week.
Still, there were some big news in the past few days. First, several altcoins have continued surging, with Solana and Avalanche continuing surging. Solana moved above $100 for the first time since 2022.
Second, the Securities and Exchange Commission (SEC) scored a big victory in its lawsuit against BarnBridge. In it, the agency won $1.7 million settlement and blasted Decentralized Autonomous Organizations (DAO).
Third, and most importantly, more economic data from the United States showed that inflation continued falling in November. The core PCE, which excludes the volatile food and energy products, continued falling.
The six-month core PCE dropped to 1.9% for the first time in over three years. It has dropped from 5.9% during the pandemic. The core PCE rose to 0.1% from October to November.
These numbers mean that inflation will continue falling in the coming months. If this happens, the Fed will likely start cutting rates in the coming months, a major reversal from what it did in the past two years.
The hope of a Fed pivot is one of the main reasons why Bitcoin and other cryptocurrencies has jumped in the past few months. The other reasons are the rising possibility that the SEC will approve a Bitcoin ETF and the upcoming halving.
BTC/USD technical analysis
The BTC/USD pair has moved sideways in the past few weeks. It has remained at 43,400, where it has been recently. Bitcoin’s volume has continued moving downwards during this Christmas season while the Relative Strength Index (RSI) has drifted sideways.
There are also signs that Bitcoin has formed a double-top pattern. In most cases, this pattern is one of the most bearish ones in the market. Therefore, the pair will likely continue falling as sellers target the support at 42,600.

More By This Author:
GBP/USD Analysis: Bulls in Control, Waiting For StimulusWeekly Forex Forecast – USD/CHF EUR/USD USD/CAD Nasdaq 100 Cocoa Futures
EUR/USD: Weekly Forecast 24th December - 30th December
Disclosure: DailyForex will not be held liable for any loss or damage resulting from reliance on the information contained within this website including market news, analysis, trading signals ...
more


