AUD/USD Forex Signal: A Rising Wedge Pattern Forms
Bearish view
- Sell the AUD/USD pair and set a take-profit at 0.6750.
- Add a stop-loss at 0.6900.
- Timeline: 1-2 days.
Bullish view
- Set a buy-stop at 0.6825 and a take-profit at 0.6925.
- Add a stop-loss at 0.6750.
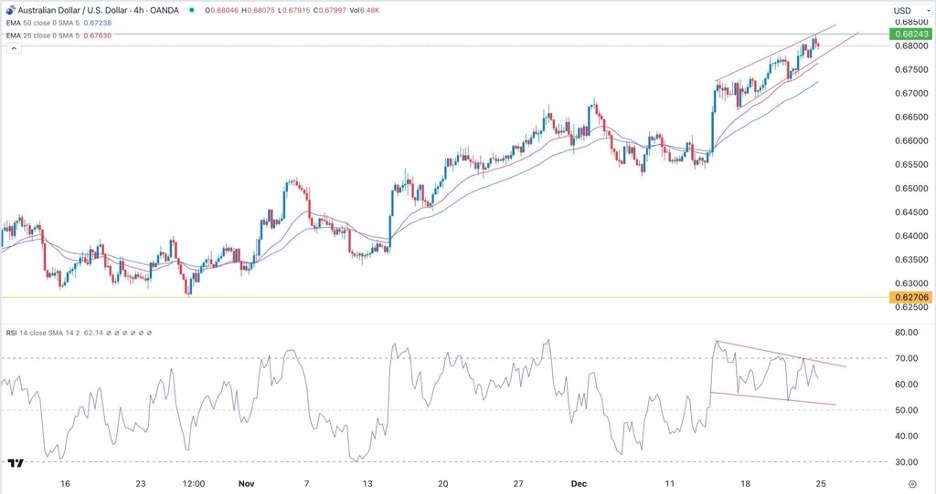
The Australian dollar continued rising this week as traders continued to bet on diverging paths between the Federal Reserve and the Reserve Bank of Australia (RBA). The pair jumped to a high of 0.6825 on Tuesday, its highest point since July 20th. It has risen sharply from November’s low of 0.6270.
RBA and Fed outlooks
There is a likelihood that the Reserve Bank of Australia and the Fed will diverge, at least in the first half of 2024. RBA minutes published last week revealed that the RBA considered hiking rate in its December meeting as inflation remained stubbornly high.
Michelle Bullock, RBA’s central bank governor, has hinted that the bank will consider hiking rates in 2024. The bank is waiting for the latest Q4 inflation report, which will come out in January.
The most recent report revealed that inflation remained at an elevated level in Q3. According to the ABS, the headline inflation eased to 4.9% in November, still much higher than the bank’s target of 2.0%.
The Fed, on the other hand, has changed its tune on interest rates. In its December meeting, the bank left rates unchanged for the third straight meeting. It also hinted that it will cut rates three times in 2024 and analysts believe that the cuts will start in March.
The case for sooner cuts was emphasized on Friday when the US published encouraging PCE data. According to BEA, the core PCE rose by 0.1% from a month earlier and by 3.2% from the same period in 2023.
This is an important number since it is the Fed’s favourite inflation gauge. As such, signs that it is falling is a good indicator that the Fed will start cutting rates soon.
AUD/USD technical analysis
The AUD/USD pair has been in a strong uptrend in the past few weeks. It has remained above the 25-period and 50-period moving averages on the 4H chart. The pair’s Relative Strength Index (RSI) has also formed a bearish divergence pattern. In price action analysis, this is one of the most bearish signs.
Therefore, while the long-term trend is bullish, the pair will likely pull back in the coming days as some buyers start taking profits. If this happens, the pair will likely retest the key support at 0.6750. A move above this month’s high of 0.6825 will invalidate the bearish view.
(Click on image to enlarge)

More By This Author:
BTC/USD Forex Signal: Bitcoin Wavers As Santa Rally FadesGBP/USD Analysis: Bulls in Control, Waiting For Stimulus
Weekly Forex Forecast – USD/CHF EUR/USD USD/CAD Nasdaq 100 Cocoa Futures
Disclosure: DailyForex will not be held liable for any loss or damage resulting from reliance on the information contained within this website including market news, analysis, trading signals ...
more


