BTC/USD Forex Signal: Bitcoin Price Braces For More Gains
Bullish view
- Buy the BTC/USD pair and set a take-profit at 70,000.
- Add a stop-loss at 64,000.
- Timeline: 1-2 days.
Bearish view
- Set a sell-stop at 65,000 and a take-profit at 63,000.
- Add a take-profit at 68,000.
(Click on image to enlarge)
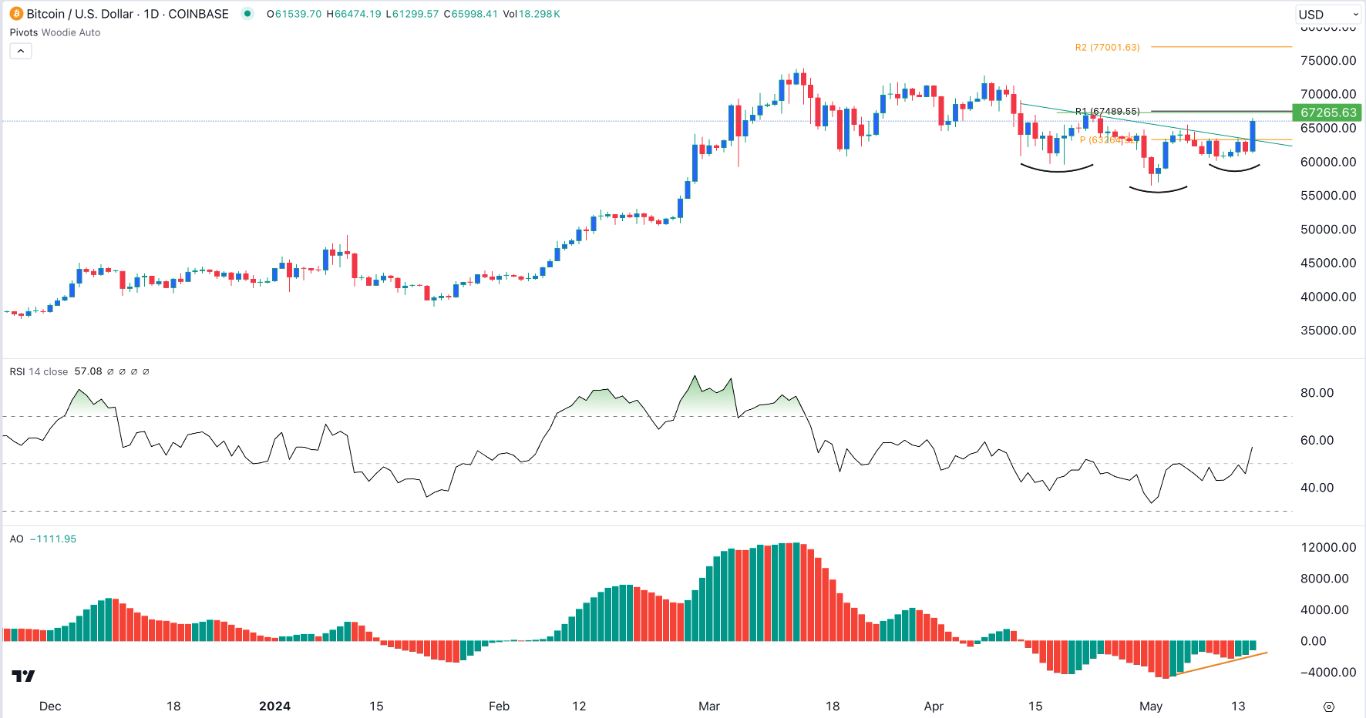
The price of Bitcoin made a bullish breakout after the soft US inflation numbers sparked a risk-on sentiment in the financial market. The BTC/USD pair surged to a high of 66,000, its highest swing since April 24th.
Risk-on sentiment has prevailed
Bitcoin jumped sharply after a report revealed that inflation moderated in April, raising the probability that the Fed will start cutting rates later this year.
As a result, the fear and greed index rose to 52, up from this week’s low of 49. Also, the US dollar index tumbled to its lowest swing in over a month while American stocks surged to their highest levels on record.
The Dow Jones, S&P 500, and Nasdaq 100 indices soared to $39,900, $5,303, and $5,300, respectively. Also, the CBOE Volatility Index (VIX) tumbled by over 7% to $12.50.
Economic numbers revealed that the headline Consumer Price Index (CPI) softened from 0.4% to 0.0% while core inflation fell to 0.3%. Another report showed that the volume of retail sales dropped in April.
These numbers confirmed that the economy was softening. A previous report showed that the country’s consumer confidence and manufacturing PMI continued dropping.
Therefore, the Federal Reserve will likely start cutting rates in the third quarter of the year to supercharge the economy. Bitcoin and other risky assets perform well when the Fed is pointing to rate cuts ahead.
BTC/USD technical analysis
Bitcoin has been in a tight range in the past few days. On the daily chart, the pair has been forming an inverse head and shoulders pattern. It has now moved above its neckline, which is a positive sign.
Bitcoin has also risen above the Woodie pivot point at $63,265 and is nearing its first resistance level. Also, the pair has risen above the 50-day Exponential Moving Average (EMA) and the Ichimoku cloud indicators.
The Relative Strength Index (RSI) has pointed upwards to 57 while the Awesome Oscillator has formed three consecutive green bars and is nearing the neutral point. Therefore, the outlook for the pair is bullish, with the next target being at 70,000. The alternative scenario is where it retreats and retests the key support at 64,000.
More By This Author:
GBP/USD Forex Signal: Bullish Momentum Gains Steam
AUD/USD Forex Signal - Extremely Bullish Above 0.6645
GBP/USD Forex Signal: Bearish Breakout Possible As H&S Pattern Forms
Disclosure: DailyForex will not be held liable for any loss or damage resulting from reliance on the information contained within this website including market news, analysis, trading signals ...
more


