GBP/USD Forex Signal: Bearish Breakout Possible As H&S Pattern Forms
Bearish view
- Sell the GBP/USD pair and set a take-profit at 1.2500.
- Add a stop-loss at 1.2630.
- Timeline: 1-2 days.
Bullish view
- Set a buy-stop at 1.2570 and a take-profit at 1.2630.
- Add a stop-loss at 1.2500.
(Click on image to enlarge)
The GBP/USD exchange rate rose to its highest swing in a week ahead of a busy week in the forex market as the US publishes the latest inflation and retail sales numbers. It was trading at 1.2556 on Tuesday, up from last week’s low of 1.2450.
Busy week ahead
The GBP/USD pair held steady after the UK published strong GDP numbers on Friday. According to the Office of National Statistics (ONS), the economy expanded by 0.6% in Q1, higher than the expected 0.4%. That increase meant that the country moved out of a recession.
Economists are torn on when the BoE will start slashing rates. In a note, UBS economists noted that the first cut will likely come in June rather than in August. This is in line with the swap and bond market.
Looking ahead, it will be a calm week in the UK data-wise. The only crucial data to watch will be on Tuesday morning when the ONS will publish the latest jobs numbers. Economists expect the report to reveal that the unemployment rate rose to 5.3% while the average earnings index rose to 5.3%.
The next key event on Tuesday will be a statement from Huw Pill, BoE’s Chief Economist. In his recent statements, he has continued to warn against cutting rates soon since inflation remained above the bank’s target.
The biggest event of the week will be the upcoming statement by Jerome Powell, the head of the Federal Reserve. It will be his first statement after the Fed decided to leave interest rates unchanged between 5.25% and 5.50%.
His statement will come a day ahead of the US Consumer Price Index (CPI) data set for Wednesday. Economists expect the data to show that inflation remained stubbornly high in April.
GBP/USD technical analysis
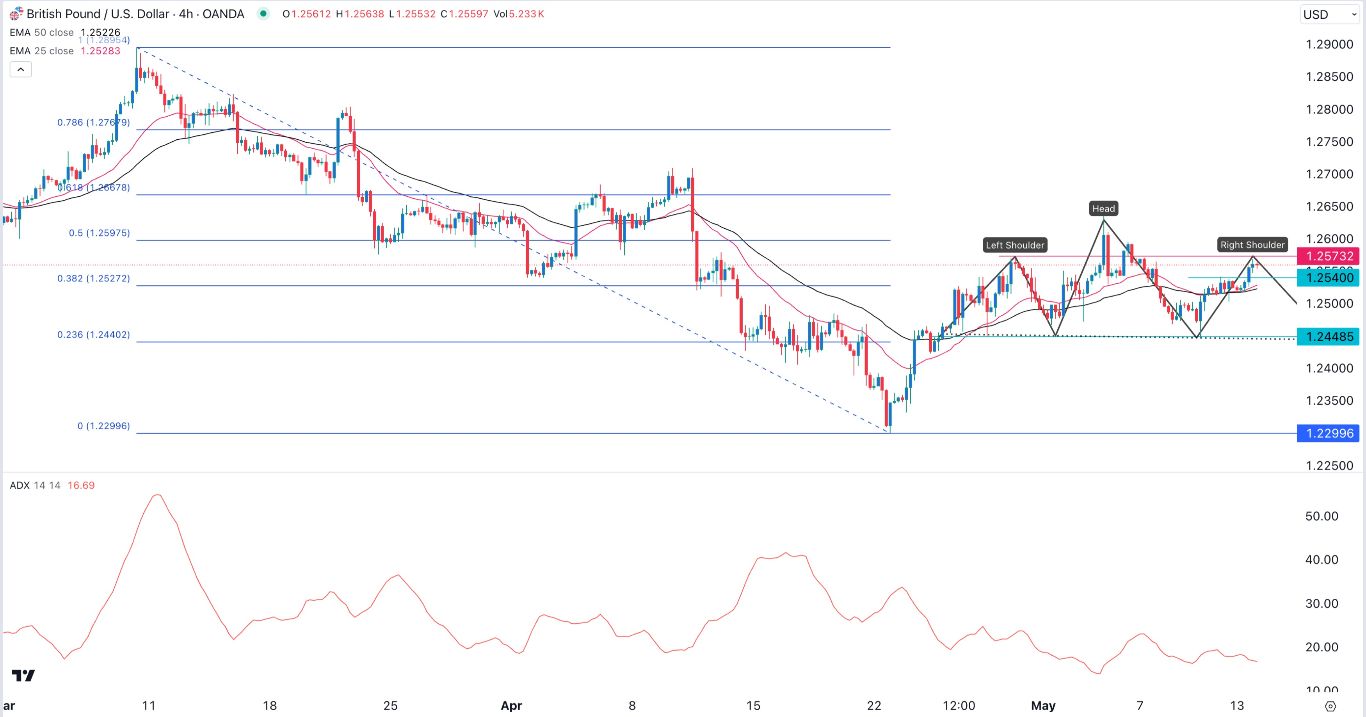
The GBP/USD pair rose to the crucial resistance level of 1.2573 on Monday. This was an important level since it coincided with its highest point on April 29th. It was the highest swing on April 29th and the right side of the head and shoulders (H&S) pattern.
It is also hovering between 38.2% and 50% Fibonacci Retracement level and is slightly above the 50-period Exponential Moving Average (EMA). The Average Directional Index has pointed downwards, meaning that the trend is not strong.
Therefore, because of the H&S pattern, the pair will likely resume the downward trend ahead of the US inflation report. The key level to watch will be at 1.2500. A move above the right shoulder at 1.2573 will invalidate the bearish view.
More By This Author:
BTC/USD Forex Signal: Ray Of Hope As Inverse H&S Pattern FormsAUD/USD Forex Signal: Small Bullish Flag Forms Ahead Of US PPI, CPI Data
Here’s Why Coinbase Should Acquire Robinhood
Disclosure: DailyForex will not be held liable for any loss or damage resulting from reliance on the information contained within this website including market news, analysis, trading signals ...
more


