AUD/USD Forex Signal - Extremely Bullish Above 0.6645
Bullish view
- Buy the AUD/USD pair and set a take-profit at 0.6700.
- Add a stop-loss at 0.6550.
- Timeline: 1-2 days.
Bearish view
- Set a sell-stop at 0.6600 and a take-profit at 1.06500.
- Add a stop-loss at 0.6700.
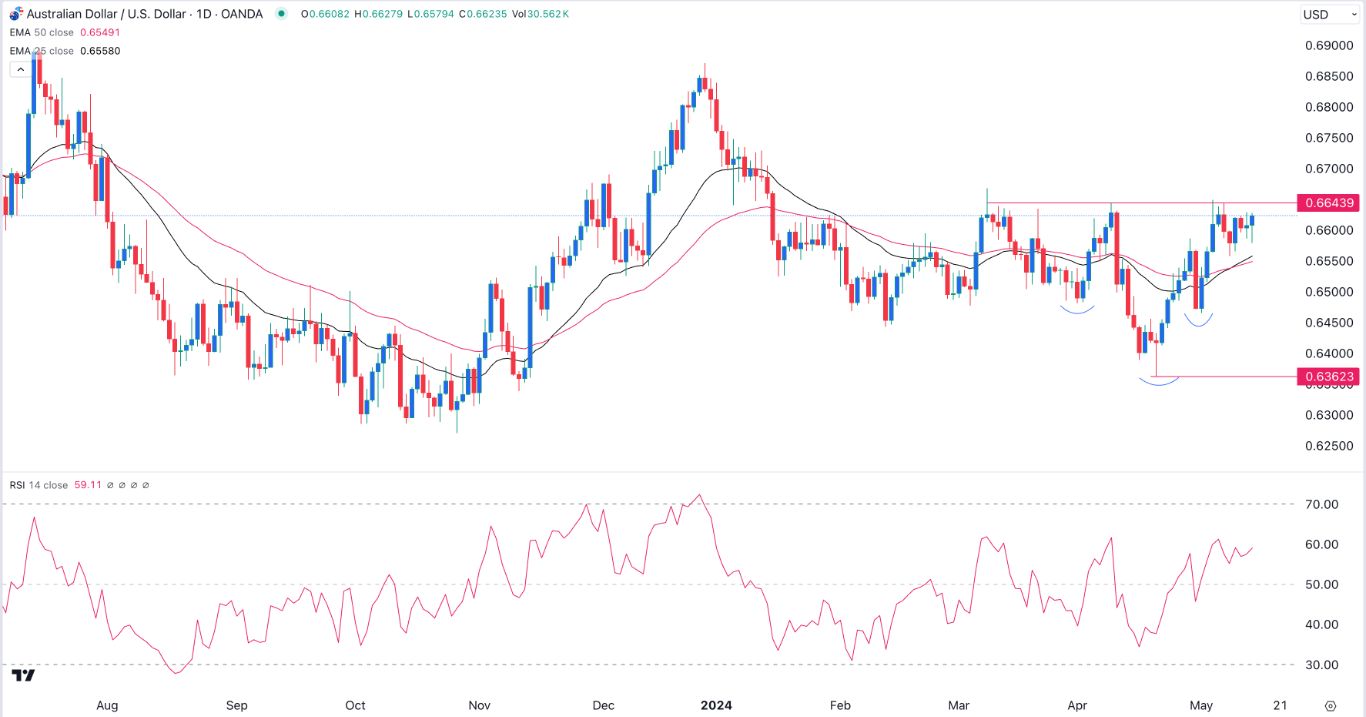
(Click on image to enlarge)
The AUD/USD exchange rate held steady after a hotter-than-expected inflation report from the US and a hawkish statement by Jerome Powell. The Aussie rose to 0.6620 against the greenback as bulls target the crucial resistance point at 0.6645.
US CPI report ahead
There are signs that US inflation is getting stickier than expected. April’s Producer Price Index (PPI) rose by 0.5% MoM in April after dropping by 0.1% in March, translating to a YoY increase of 2.2%.
Excluding the volatile items, the PPI figure rose to 0.5% MoM and by 2.4% YoY. These numbers signal that US producers are still seeing elevated costs.
The US will next publish the closely watched Consumer Price Index (CPI) report. Economists believe that the CPI remained at an uncomfortable level as energy, medical, insurance, and housing costs rose. The consensus is that the headline CPI rose by 0.4% MoM and 3.4% YoY in April.
The core CPI is expected to come in at 0.3% MoM and 3.6% YoY. If the actual numbers are higher than these, it could be a signal that the Federal Reserve will maintain interest rates higher for longer even as the economy slows.
In a statement on Tuesday, Jerome Powell, said that the Fed will be patient when determining when to start cutting interest rates. He expects the Fed to take longer than previously thought to start cutting rates.
The other crucial economic number will come from Australia on Thursday when the statistics agency publishes April jobs numbers. The median estimate is that the economy created 25.3k jobs in April after shedding 6.6k in March.
Like the Fed, Australia’s central bank is concerned about the stubbornly high inflation, which has continued to remain above its 2% target.
AUD/USD technical analysis
The Aussie remained steady on Wednesday morning as it neared the crucial resistance level at 0.6645. It has failed to move above this level since March 12th. It is also the neckline of the inverse head and shoulders pattern that has formed on the daily chart.
Meanwhile, the 25-day and 50-day Exponential Moving Averages (EMA) have formed a bullish crossover while the RSI has moved above the neutral level. Therefore, more upside will be confirmed if the pair rises above the resistance at 0.6645.
The alternative scenario is where the pair hits the resistance at 0.6645 and then resumes the downward trend.
More By This Author:
GBP/USD Forex Signal: Bearish Breakout Possible As H&S Pattern FormsBTC/USD Forex Signal: Ray Of Hope As Inverse H&S Pattern Forms
AUD/USD Forex Signal: Small Bullish Flag Forms Ahead Of US PPI, CPI Data
Disclosure: DailyForex will not be held liable for any loss or damage resulting from reliance on the information contained within this website including market news, analysis, trading signals ...
more


