
Following futures positions of non-commercials are as of July 9, 2024.
10-year note: Currently net short 417.9k, up 72.5k.
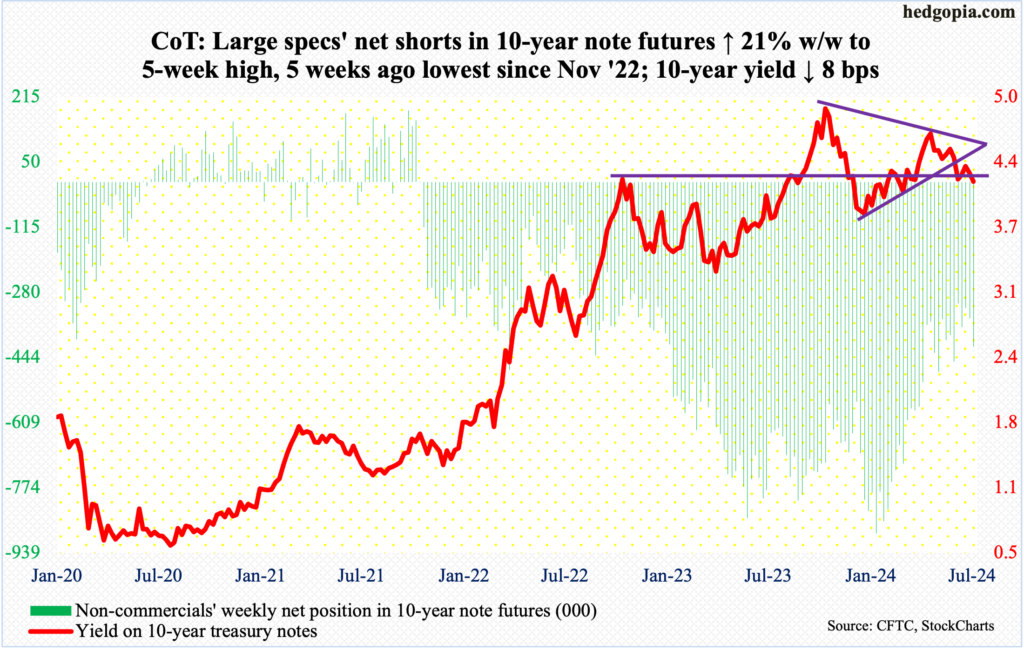
Futures traders this week jacked up their rate-cutting bets for this year. They now expect, with 90 percent probability, the first cut to occur in September (17-18), followed by the second in November (6-7) with 60 percent probability and the third in December (17-18) with just under 54 percent probability.
This followed June’s CPI, published on Thursday, which confirmed the prevailing disinflation trend (more on this here). Speaking to Congress this week, Federal Reserve Chair Jerome Powell suggested the case for cuts is getting stronger.
The FOMC meets later this month (30-31), during which the fed funds rate is expected to be left unchanged at a range of 525 basis points to 550 basis points; the last hike was last July. As things stand, a September cut is beginning to look like a done deal, with November a toss-up, but expecting three 25-basis-point cuts is pushing it.
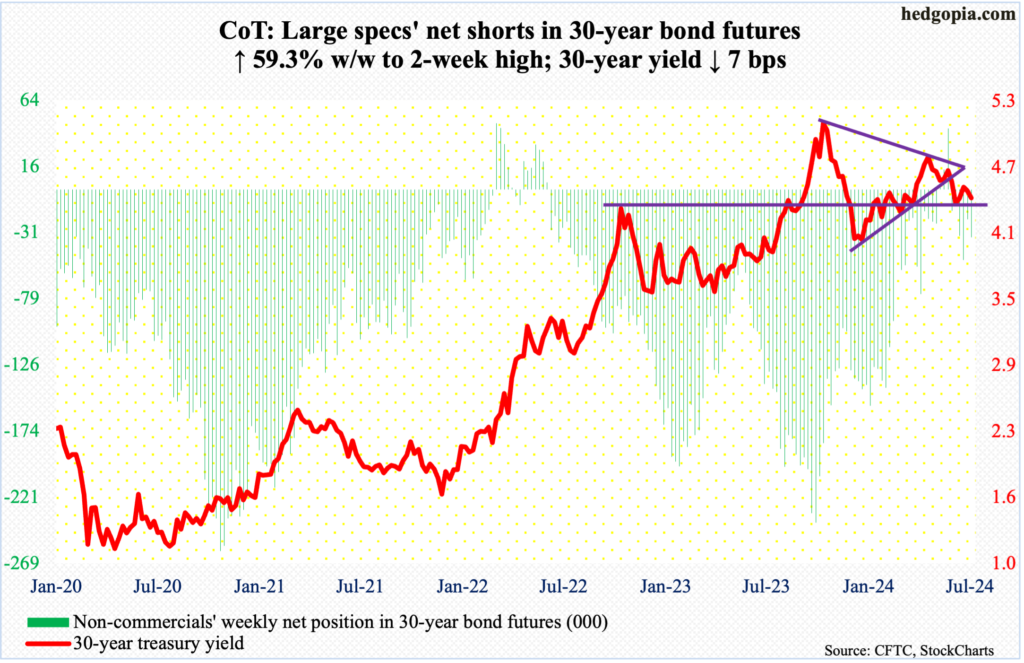
30-year bond: Currently net short 34.4k, up 12.8k.
Major US economic releases for next week are as follows.
Retail sales (June) and the NAHB housing market index are scheduled for Wednesday.
Retail sales inched up 0.09 percent month-over-month in May to a seasonally adjusted annual rate of $703.1 billion – not too far away from March’s record $703.7 billion.
Homebuilder optimism declined two points m/m in June to 43 – a six-month low.
Housing starts (June) and industrial production (June) come out Wednesday.
In May, housing starts decreased 5.5 percent m/m to 1.28 million units (SAAR), which is the lowest since June 2020.
Capacity utilization in May rose 0.6 percent m/m to 78.2 percent. January’s 77.4 percent was the lowest since April 2021.
WTI crude oil: Currently net long 300k, up 5.4k.
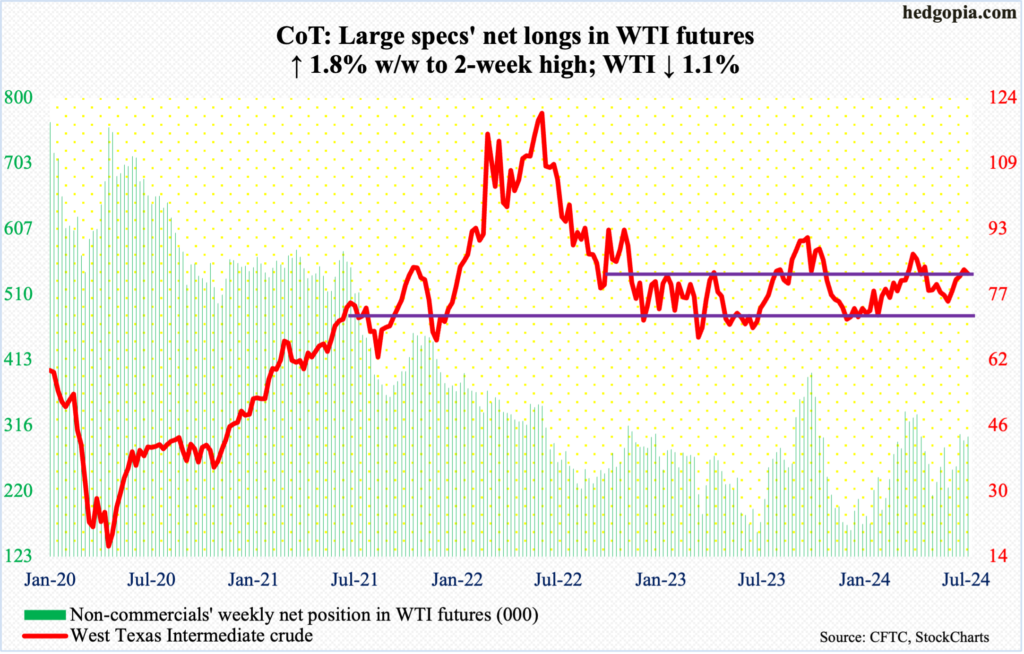
In May last year, West Texas Intermediate crude bottomed at $63.57, earlier having peaked at $130.50 in March 2022. After the May bottom, it then peaked at $95.03 last September – for a lower high. Another lower high was hit this April when the crude retreated after ticking $87.67. A falling trendline from the September high drew sellers last week at $84.52. This week, WTI gave back 1.1 percent to $82.21/barrel.
Inability to defend $81-$82, which marks the top end of a 10-point range, opens the possibility that WTI eventually heads toward $74, which is where a rising trendline from the May 2023 bottom lies.
In the meantime, US crude production increased 100,000 barrels per day week-over-week to 13.3 million b/d, matching a record which was hit eight times from last December to February. Crude imports rose 213,000 b/d to 6.8 mb/d. As did distillate stocks, growing 4.9 million barrels to 124.6 million barrels. Stocks of crude and gasoline, however, fell – down 3.4 million barrels and two million barrels respectively to 445.1 million barrels and 229.7 million barrels. Refinery utilization increased 1.9 percentage points to 95.4 percent.
E-mini S&P 500: Currently net short 55k, up 43.2k.
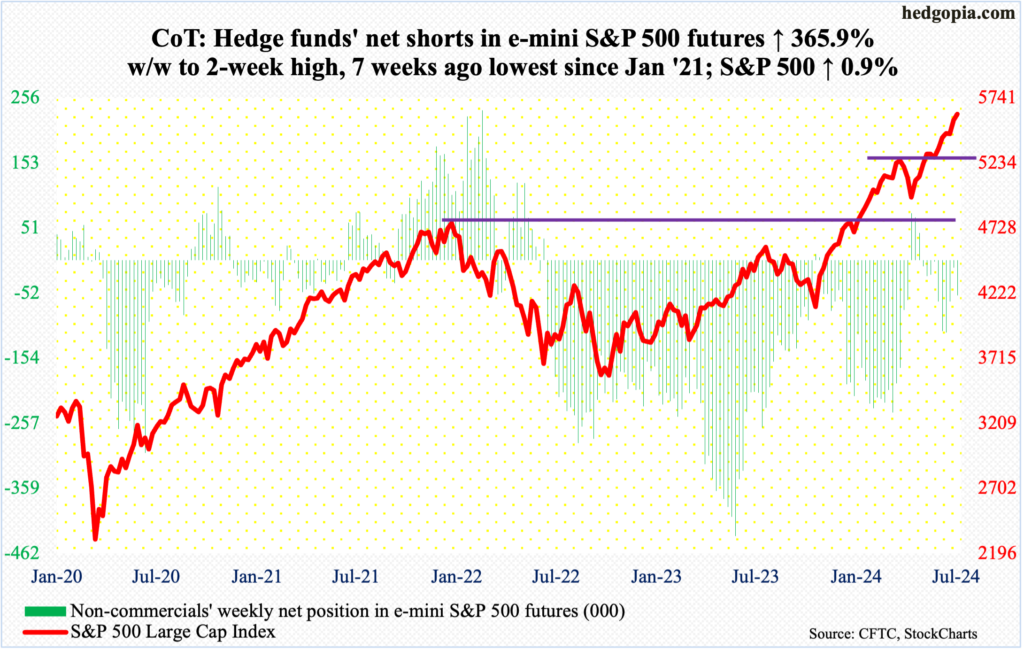
In three of the last four weeks, the weekly produced candles with large upper wicks, including a gravestone doji. This week, the S&P 500 rose as high as 5656 on Friday but only to then meaningfully retreat in the last half an hour to end the shooting star session at 5615. For the week, the large cap index still managed to rise 0.9 percent, but was up as much as 1.6 percent at Friday’s record high, resulting in a candle with a large upper shadow.
From April’s low, the S&P 500 has now rallied in 10 of the 12 weeks, with the weekly RSI just under 78. Except for April and May, the momentum indicator has remained north of 70 since the last week of January. Given this overbought condition and exuberant sentiment (more on this here), it should not come as a surprise to see signs of fatigue show up. Thus far, bears have been unable to capitalize on it. In the event they succeed this time, the June 12th gap-up gets filled at 5370s.
Euro: Currently net long 3.6k, up 13.1k.
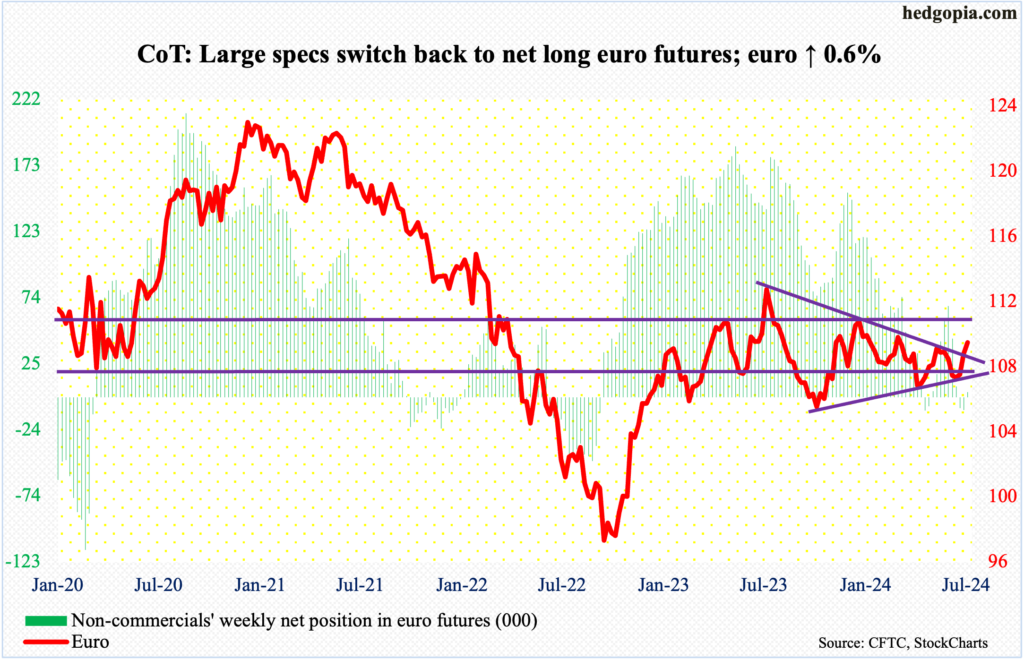
Since last July when the euro retreated after touching $1.1270, it has made lower highs. Concurrently, it has made higher lows since last October when it bottomed at $1.0448. Using closing prices, the currency broke out of the resulting symmetrical triangle – or a wedge – this week. Using intraday highs, however, the upper line lies at $1.0950. This week, it rallied 0.6 percent to $1.0903. Next week, the trendline resistance may just act like a magnet, which then likely attracts sellers.
In the meantime, a golden cross developed this week on the daily, with the 50-day moving average crossing over the 200-day. This has occurred as the daily finds itself in overbought territory.
Gold: Currently net long 254.8k, up 13.2k.
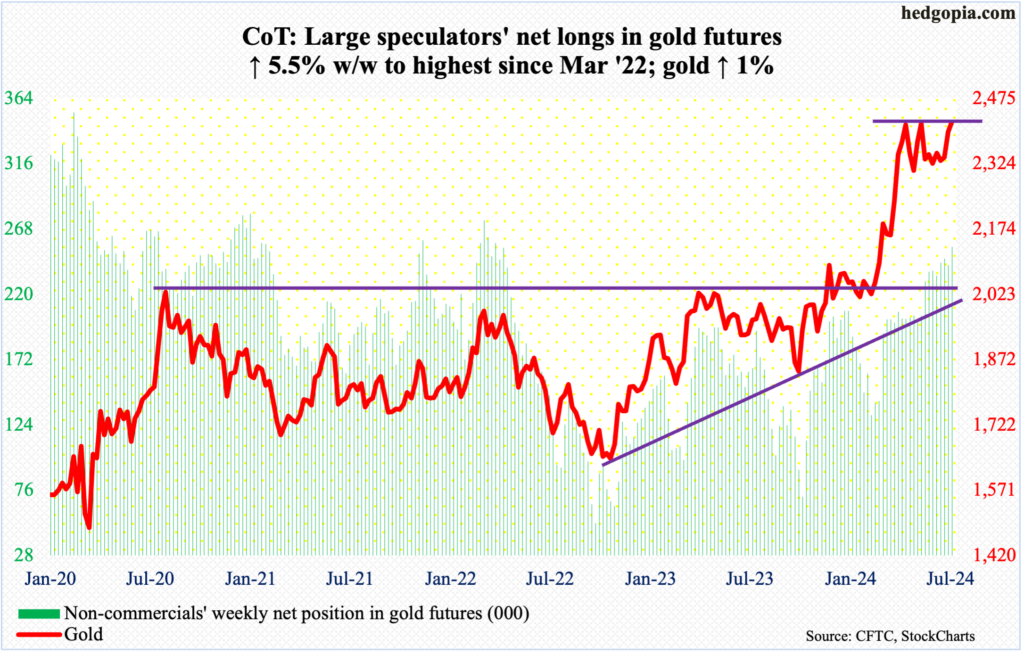
Gold is itching to break out. This week, it rose one percent to $2,421/ounce.
The metal has essentially gone sideways the past three months. On April 12th, gold hit a new intraday high of $2,449 before selling off a tad. On May 20th, a new high was created as the yellow metal ticked $2,454. All along, bids showed up at $2,300.
Amidst this, non-commercials are the most net long gold futures since March 2022.
Nasdaq (mini): Currently net long 5.2k, down 5.6k.
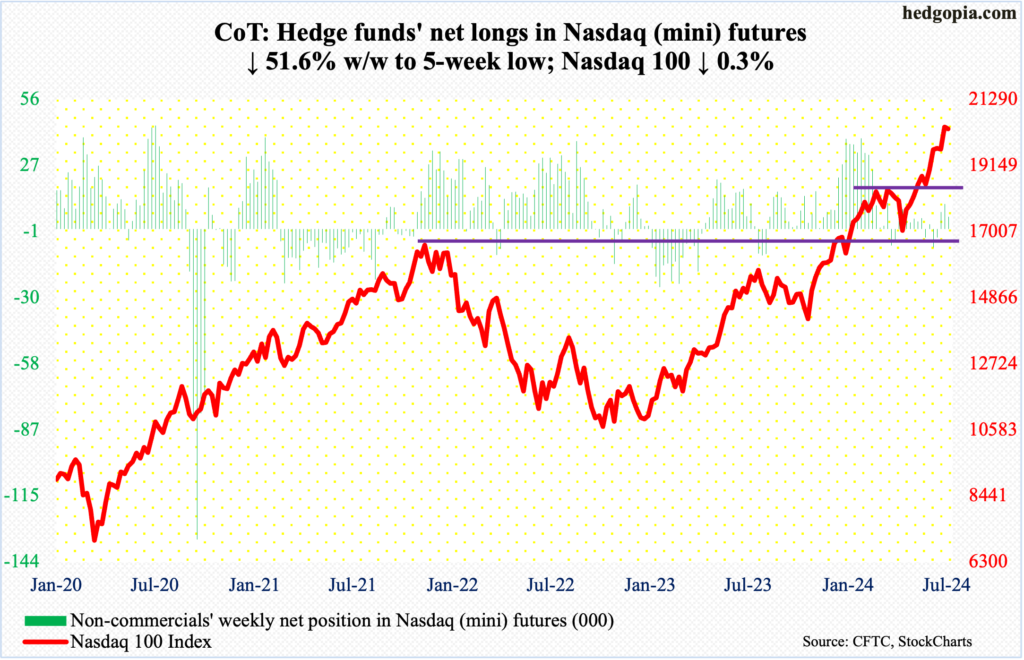
After a rip-roaring rally from last October’s low, the Nasdaq 100 is increasingly sending out signs of exhaustion; through Wednesday’s fresh all-time high of 20691, it is up 47.2 percent. It closed out the week down 0.3 percent to 20331, forming a weekly spinning top. In the prior three weeks, one more spinning top showed up three weeks ago, and this was preceded by a gravestone doji.
Conditions are way overbought, but to be fair they have been that way for a while now. The bears have had their chances, but they have not been able to fight off the bullish momentum. Here is another opportunity for them.
There is short-term horizontal support at 20000, followed by a June 12th gap fill at 19200s.
Russell 2000 mini-index: Currently net short 67.6k, down 7.8k.
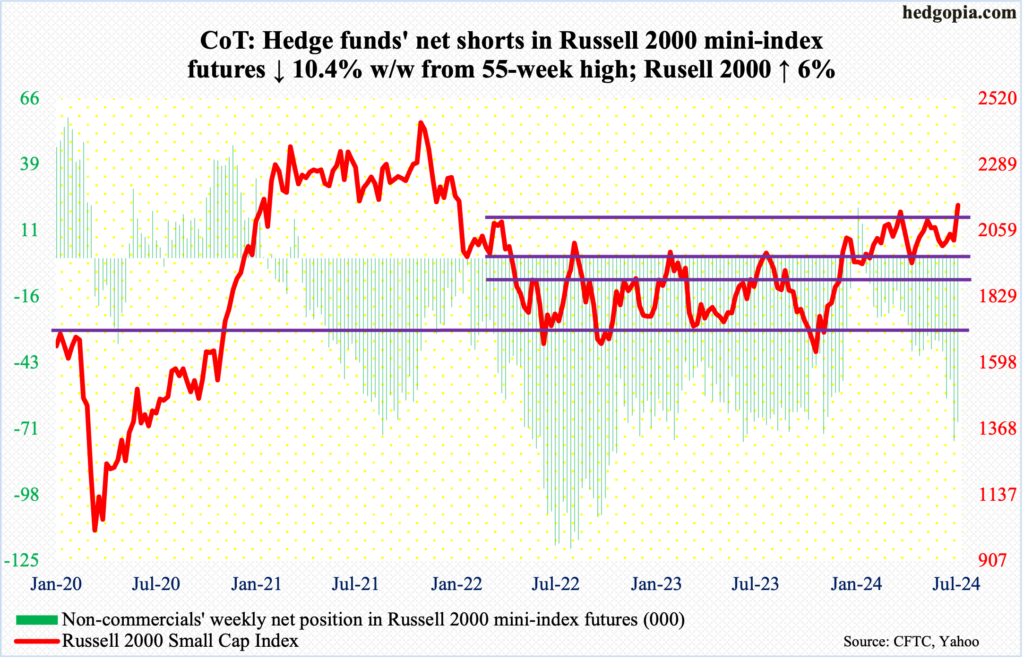
As of Tuesday, non-commercials were sitting on 67,626 net shorts in Russell 2000 mini-index futures, with the prior week’s 75,435 contracts at a 55-week high. Holdings may have changed as the week ended, as the cash rallied massively on Thursday and Friday.
After Thursday’s CPI report, there was a mini rotation from tech into small-caps – or from the leaders into the laggards. Both the Russell 2000 and the Nasdaq 100 peaked in November 2021; the former eclipsed that high last December, going on to post one after another high, while the latter remains under 2459 – its high back then.
This week, the Russell 2000 jumped six percent to 2148, breaking out of 2100, although Friday ended in a shooting star, finishing the session well under its session high of 2164. For now, small-cap bulls deserve the benefit of the doubt.
The Russell 2000 has had trouble at 2100 going back to early March; the price point has proven to be a significant level.
After the November 2021 peak, the index subsequently bottomed at 1641 in June 2022, which was successfully tested in October of both 2022 and 2023. A 61.8-percent Fibonacci retracement of that drop amounts to 2144; 2100 also represents a measured-move price target post-breakout at 1900 last December. Before that, the index went back and forth between 1700 and 1900 going back to January 2022.
There will be a breakout retest at 2100 sooner than later. If it is a genuine breakout, there should be bids waiting, ready to pounce on the opportunity.
US Dollar Index: Currently net long 16.2k, down 374.
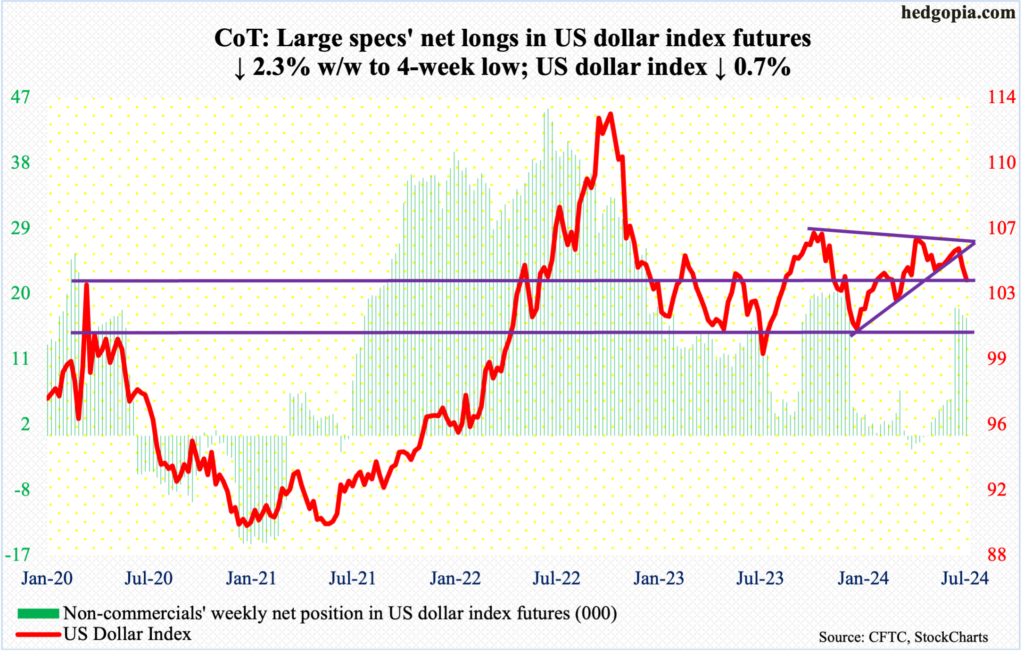
Last week, the US dollar index fell out of a symmetrical triangle, made up of a falling trendline from last October when the index peaked at 107.05 and a rising trendline from last December when the index bottomed at 100.32. This week, there was more pain for the dollar bulls as the index lost 0.7 percent to 103.78.
Horizontal support at 103-104 goes back to December 2016. This is a must-save for the bulls. The June 7th low of 103.48 is worth watching.
VIX: Currently net short 61.5k, up 8.1k.
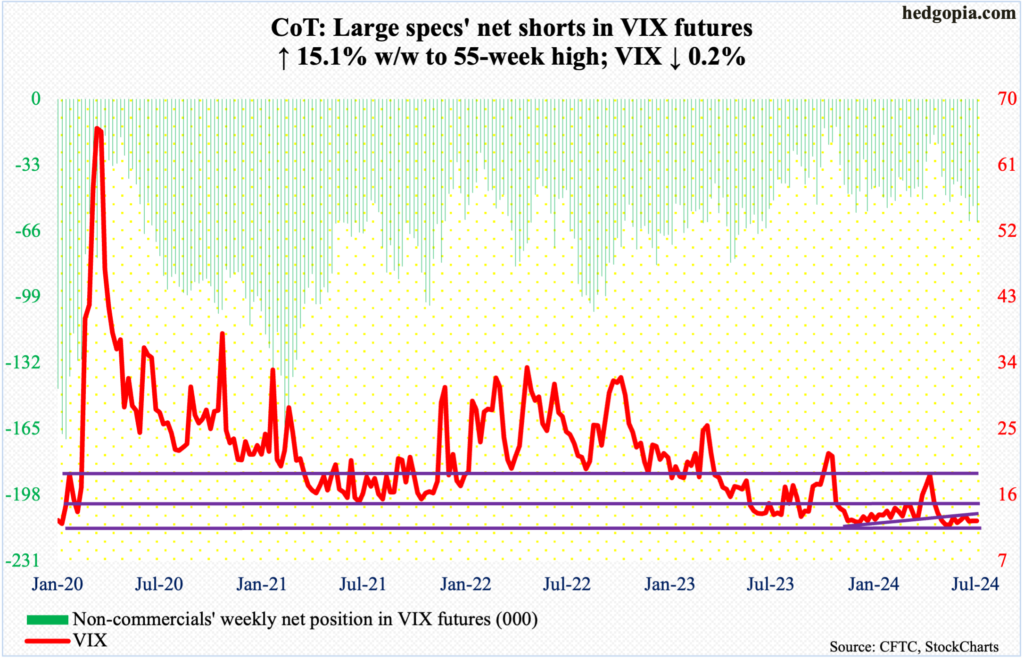
VIX has absolutely gone flat.
This week’s 12.46 close follows last week’s 12.48 and 12.44 in the week before that. In six of the last seven weeks, the volatility index ended the week with a 12 handle. The S&P 500 added more than 300 points during the period. Equity bulls would rather see volatility come under genuine pressure during this time, but VIX is holding its ground. This is the best consolation volatility bulls can have for now. Going back six years, they have repeatedly defended 12, and this is happening again. Despite this, it has been three months since VIX enjoyed a nice spike; on April 19th, it reversed hard after touching 21.36 intraday.
Thanks for reading!
More By This Author:
Equity Bulls Dread 1st Rate Cut, As This Could Touch Off ‘Sell The News’ Phenomenon
Equity Bulls Running Riot, Sentiment Lopsidedly Bullish – Market Risk High
Large-Cap Indices Give Out Signs Of Fatigue


Comments
Log in or sign up to join the conversation.