

Image Source: Pexels
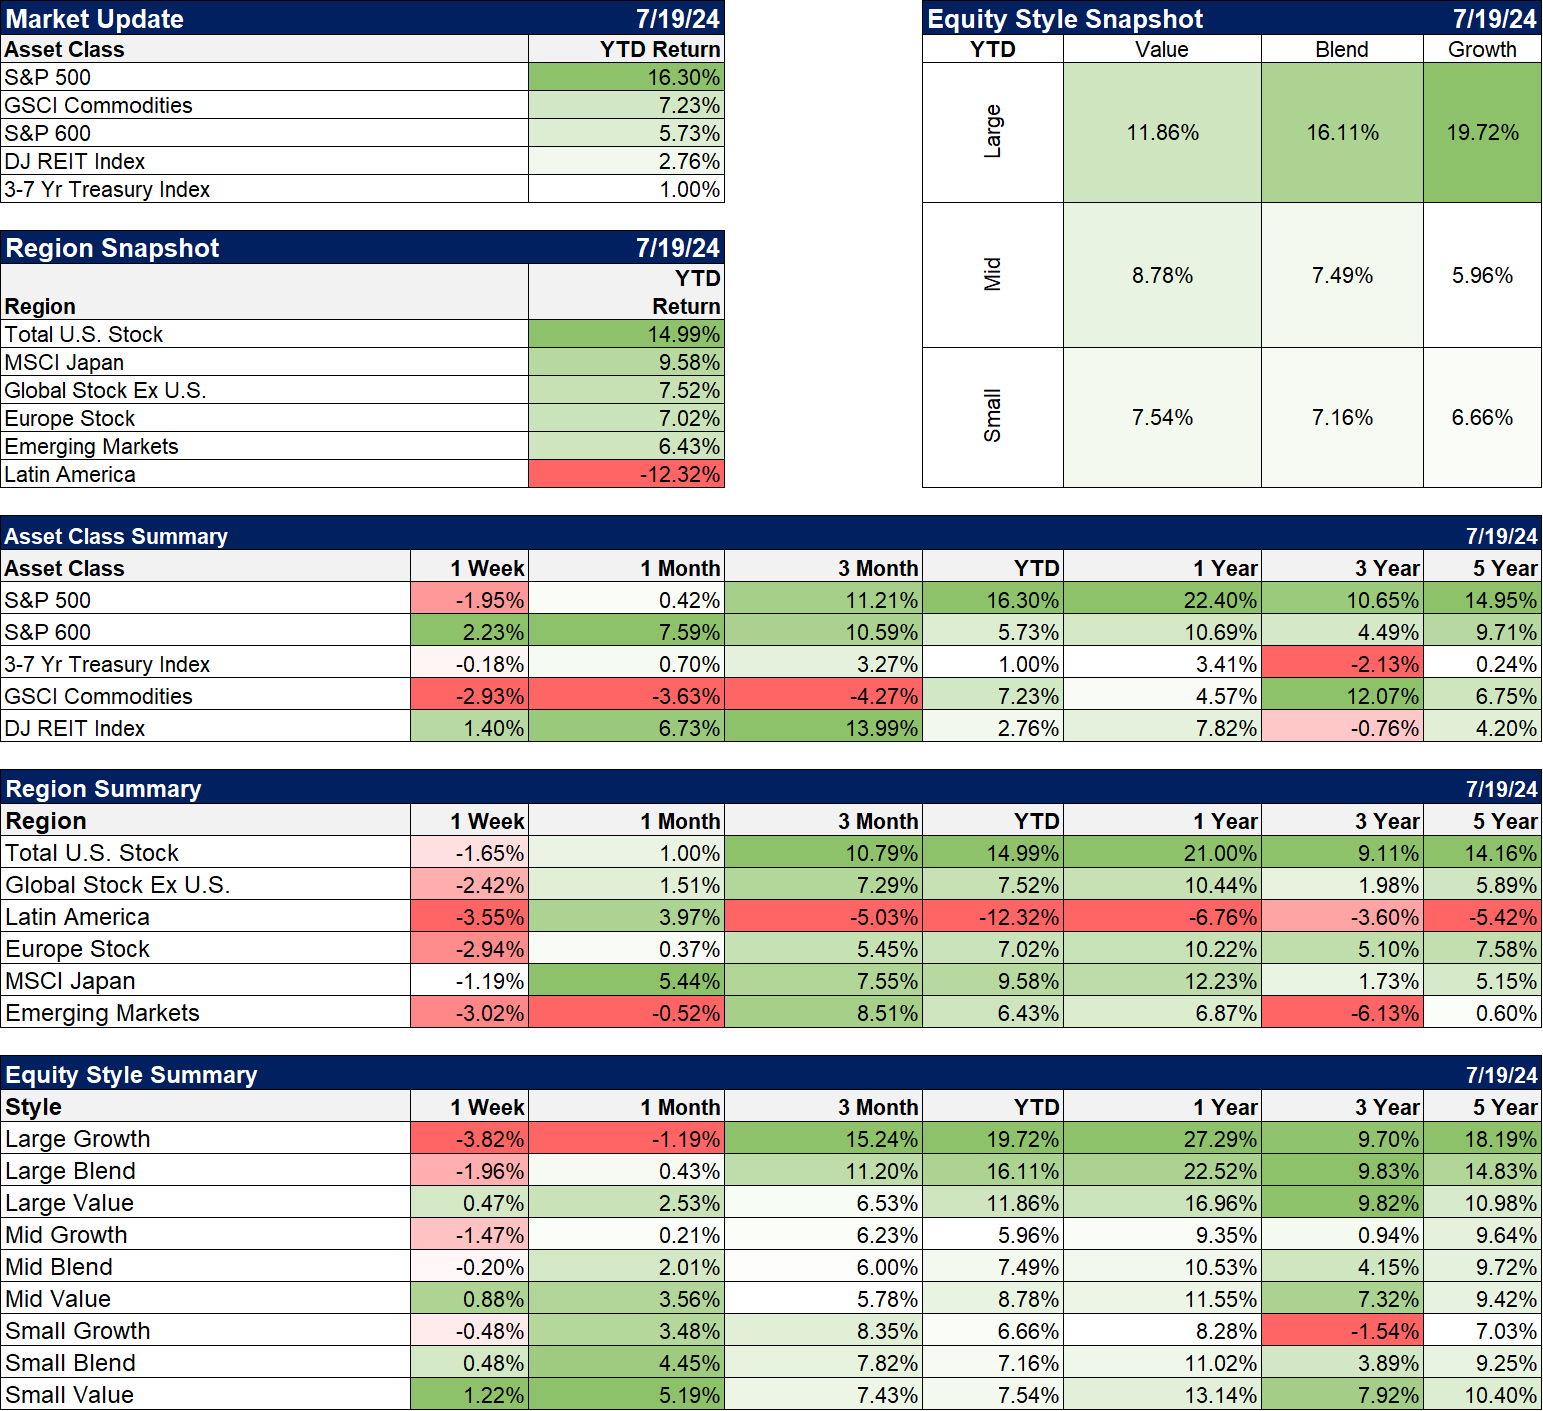
There’s been a pretty remarkable turnaround in markets over the last 10 days. At the end of June, market returns were dominated by large cap growth stocks. The Russell 1000 growth index was up 20.5% while the value index was up a mere 6.5%, a spread rarely seen over such a short period of time. The Russell 2000 index of small stocks was up just 1.6% and mid cap stocks were up 6.2%. Bonds were down slightly on the year but for diversified, balanced investors that was a big drag on portfolio returns in the first half of the year. Commodities, especially gold, were helpful, both up double digits for the year but still lagging the growth stocks badly.
The second half of the year has started much differently. Small cap stocks are up nearly 8% while the S&P 500 is up less than 1%. Large cap value stocks are up nearly 4% while large cap growth is down 1.7%. Intermediate term Treasuries are up 1.5% since July 1st. Commodities are more mixed with general commodities down 4% while gold, even after a big selloff last Friday, is up nearly 3%. The stock market selloff at the end of the last week reduced the gains in value and smaller stocks somewhat but the trend reversals are still pretty stark.
The obvious question is why this has happened now and so quickly. The most common explanation, the Occam’s Razor explanation, is that the better than expected CPI report pushed up the odds of more rate cuts before the end of the year. And that is certainly true; we’ve gone from maybe 1 rate cut in September to one almost for sure that month and better than even odds of two more in November and December. But what exactly is the market pricing in with those three rate cuts? Core inflation is dropping pretty rapidly and the PCE measure of inflation is already near the Fed’s target but does that justify reducing short term interest rates by 0.75% in the next six months? What would the impact on the economy be if they did actually cut rates to 4.5% by the end of the year?
That’s where things get interesting for investors. It’s been said that the economy is not the market and the market is not the economy and I generally agree with that. But that’s because markets are trying to suss out the future; the economy can look terrible at the bottom of a recession even as stocks are turning from bear to bull and interest rates are rising in anticipation of recovery. Markets tell you about the future economy – at last as it is perceived by most investors – while economic data tells you about the current or past economy. It is markets that shape the economy not the economy that shapes the market.
If value and smaller company stocks are rallying, what is the market trying to tell us? I’ve seen a lot of commentary since this started that the rise in these stocks – small caps especially – is being driven by rates because they have more debt. That is probably part of investor’s calculus but lower rates by themselves aren’t going to keep these stocks rising. Smaller company stocks and value stocks also tend to be more cyclical than growth stocks so if those three rate cuts implied slower growth these stocks would be more likely to fall. Since they aren’t, I think the better explanation is that they are starting to anticipate better growth.
The anticipation of three rate cuts by the end of the year is anticipation of slower Nominal GDP growth (inflation + real growth and +5.4% yoy at the end of Q1). In the best case scenario, NGDP growth falls back to 4.5% and all or at least most of the drop comes from the inflation part of that equation. A 4.5% Fed funds rate and NGDP growth of 4.5% (real growth of 2.5%, inflation of 2%) is the equilibrium the Fed is looking for. Is that possible? I think it is but I also think that any equilibrium would be short lived because lower rates would likely raise future NGDP growth.
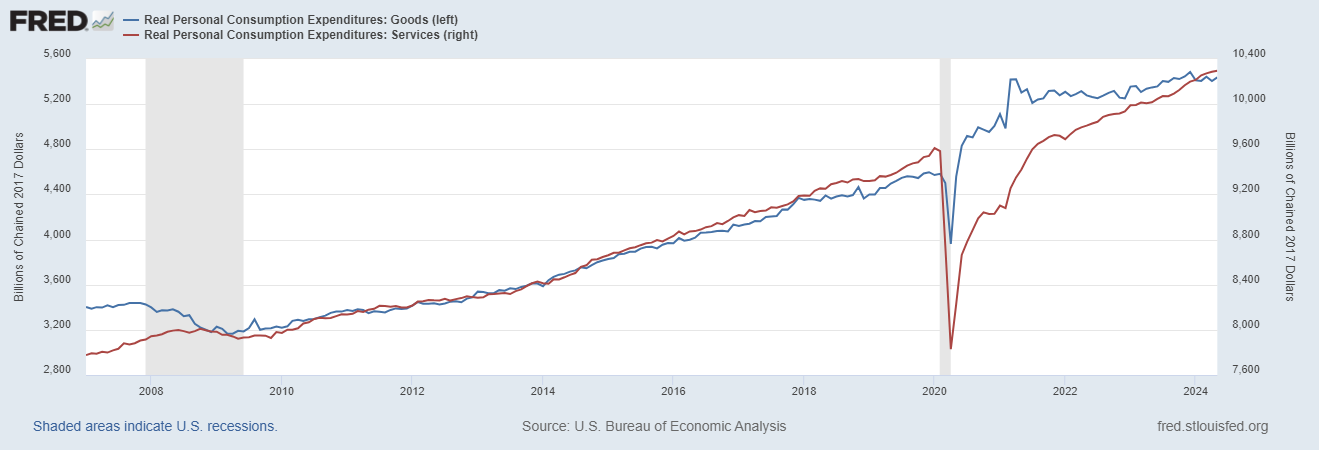
The economic recovery from COVID has been one of the strangest anyone has ever seen. The response to COVID put everything out of sync and we’ve been struggling to get back to the pre-COVID trends for the last 3 years. The mismatch of goods and services consumption is the easiest way to see the out of sync nature of the recovery. They normally move together and should again eventually, but not yet. Goods consumption soared and services consumption cratered during the early recovery phase but that has reversed over the last 18 months or so. Services have been booming while goods have marked time and worked down excess inventory from the supply chain snafus.
(Click on image to enlarge)
But retailers’ ex-autos inventories to sales ratio peaked 2 years ago and is now down to levels roughly the same as the summer of 2021 and way below pre-COVID levels. (The auto industry is still trying to build inventories back to pre-COVID levels.)
(Click on image to enlarge)
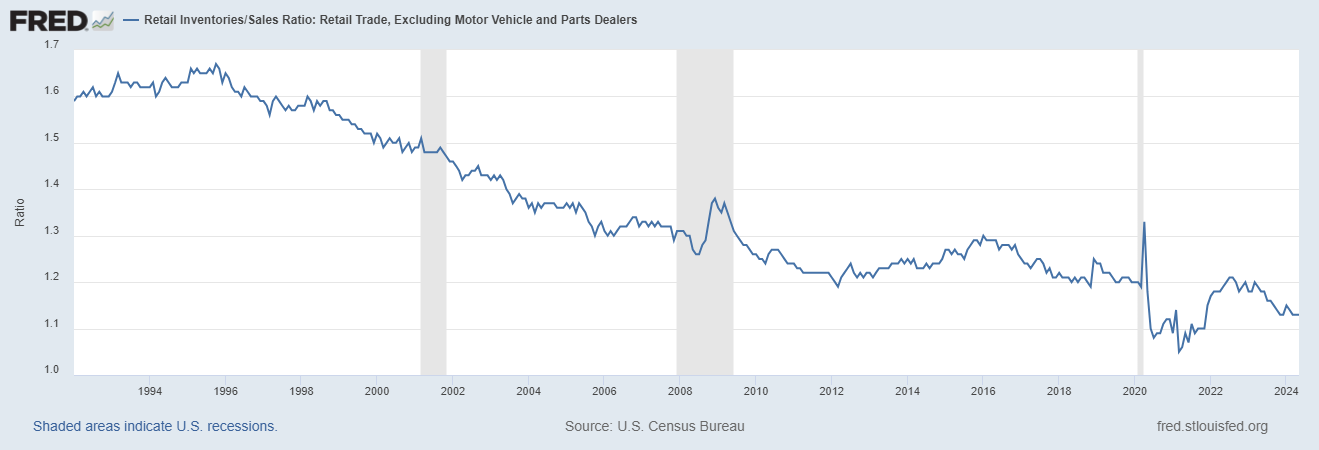
It seems obvious, at least to me, that goods production and imports are going to have to pick up to maintain inventory levels that are already low relative to sales. If inventories are to rise back to pre-COVID levels, the expected rise in production and imports will have to be even larger and that assumes no change in demand which may well prove to be a bad assumption.
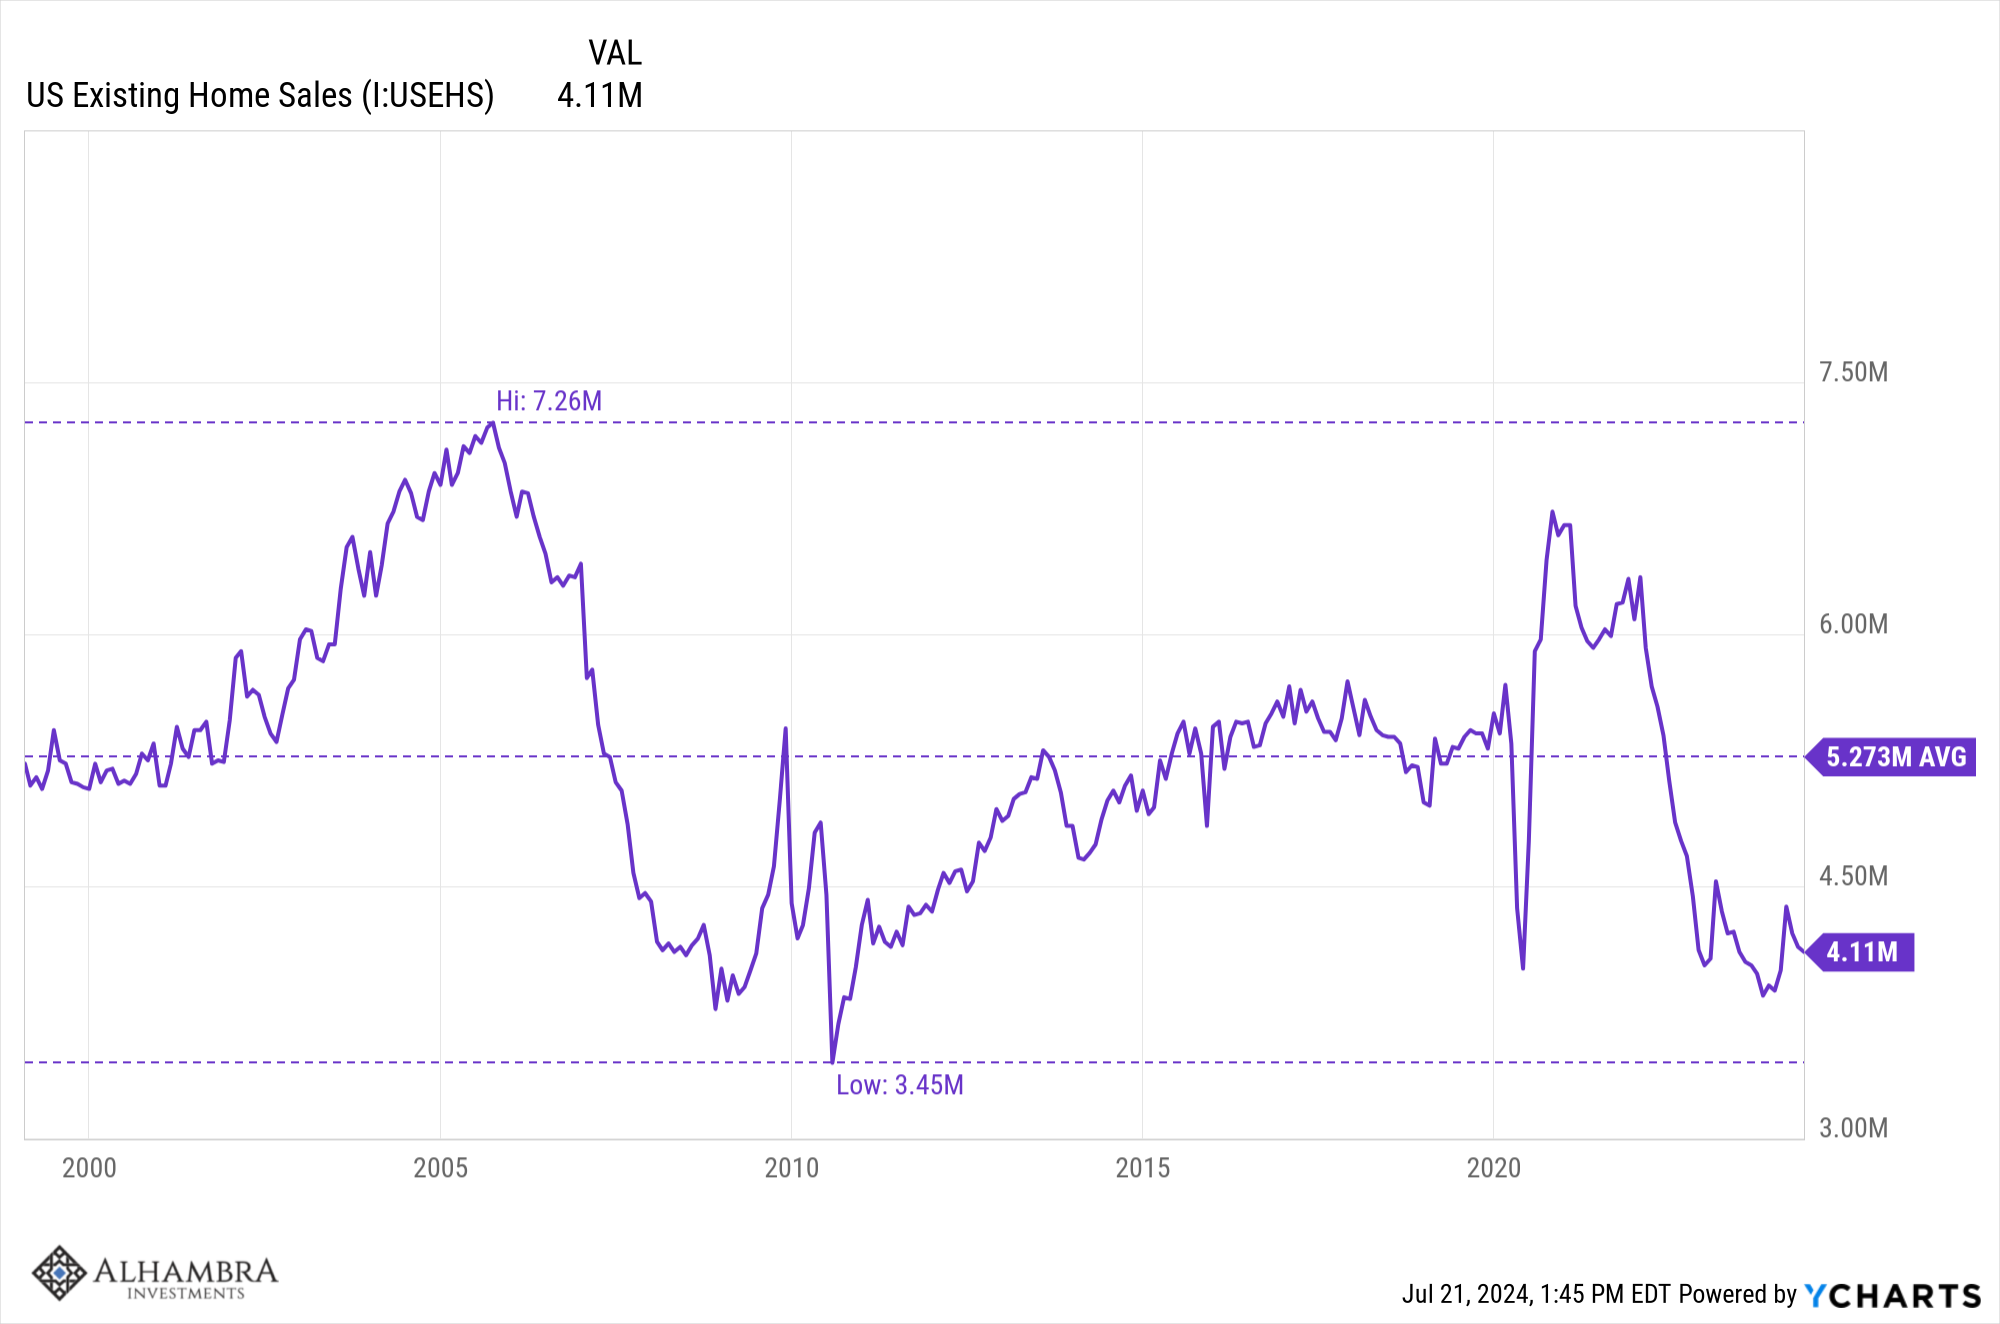
The most obvious impact of the Fed’s rate hikes has been on the real estate market where activity remains very depressed. Mortgage rates rose from close to 3% in the fall of 2021 to 7.75% in November of 2023 and that impacted the market in two ways. It reduced the supply of homes for sale as those who locked in a 3% mortgage stayed put and it also reduced demand by raising the effective price of buying a house. The result is that prices continued to rise and activity fell to levels last seen right after the 2008 crisis:
The effect on the economy goes beyond just the residential investment part of the GDP equation. Home sales create activity as new home owners buy goods to fill their new purchase; if you’ve ever moved you know what I’m talking about. If the Fed cuts rates by 0.75% by year end, it is very likely that mortgage rates will fall as well. And they will probably fall by more than just the 0.75% the Fed cuts. Why? Because mortgage rates are trading at a premium to the average spread to the 10 year Treasury rate and once the Fed starts cutting that should close to a more normal level.
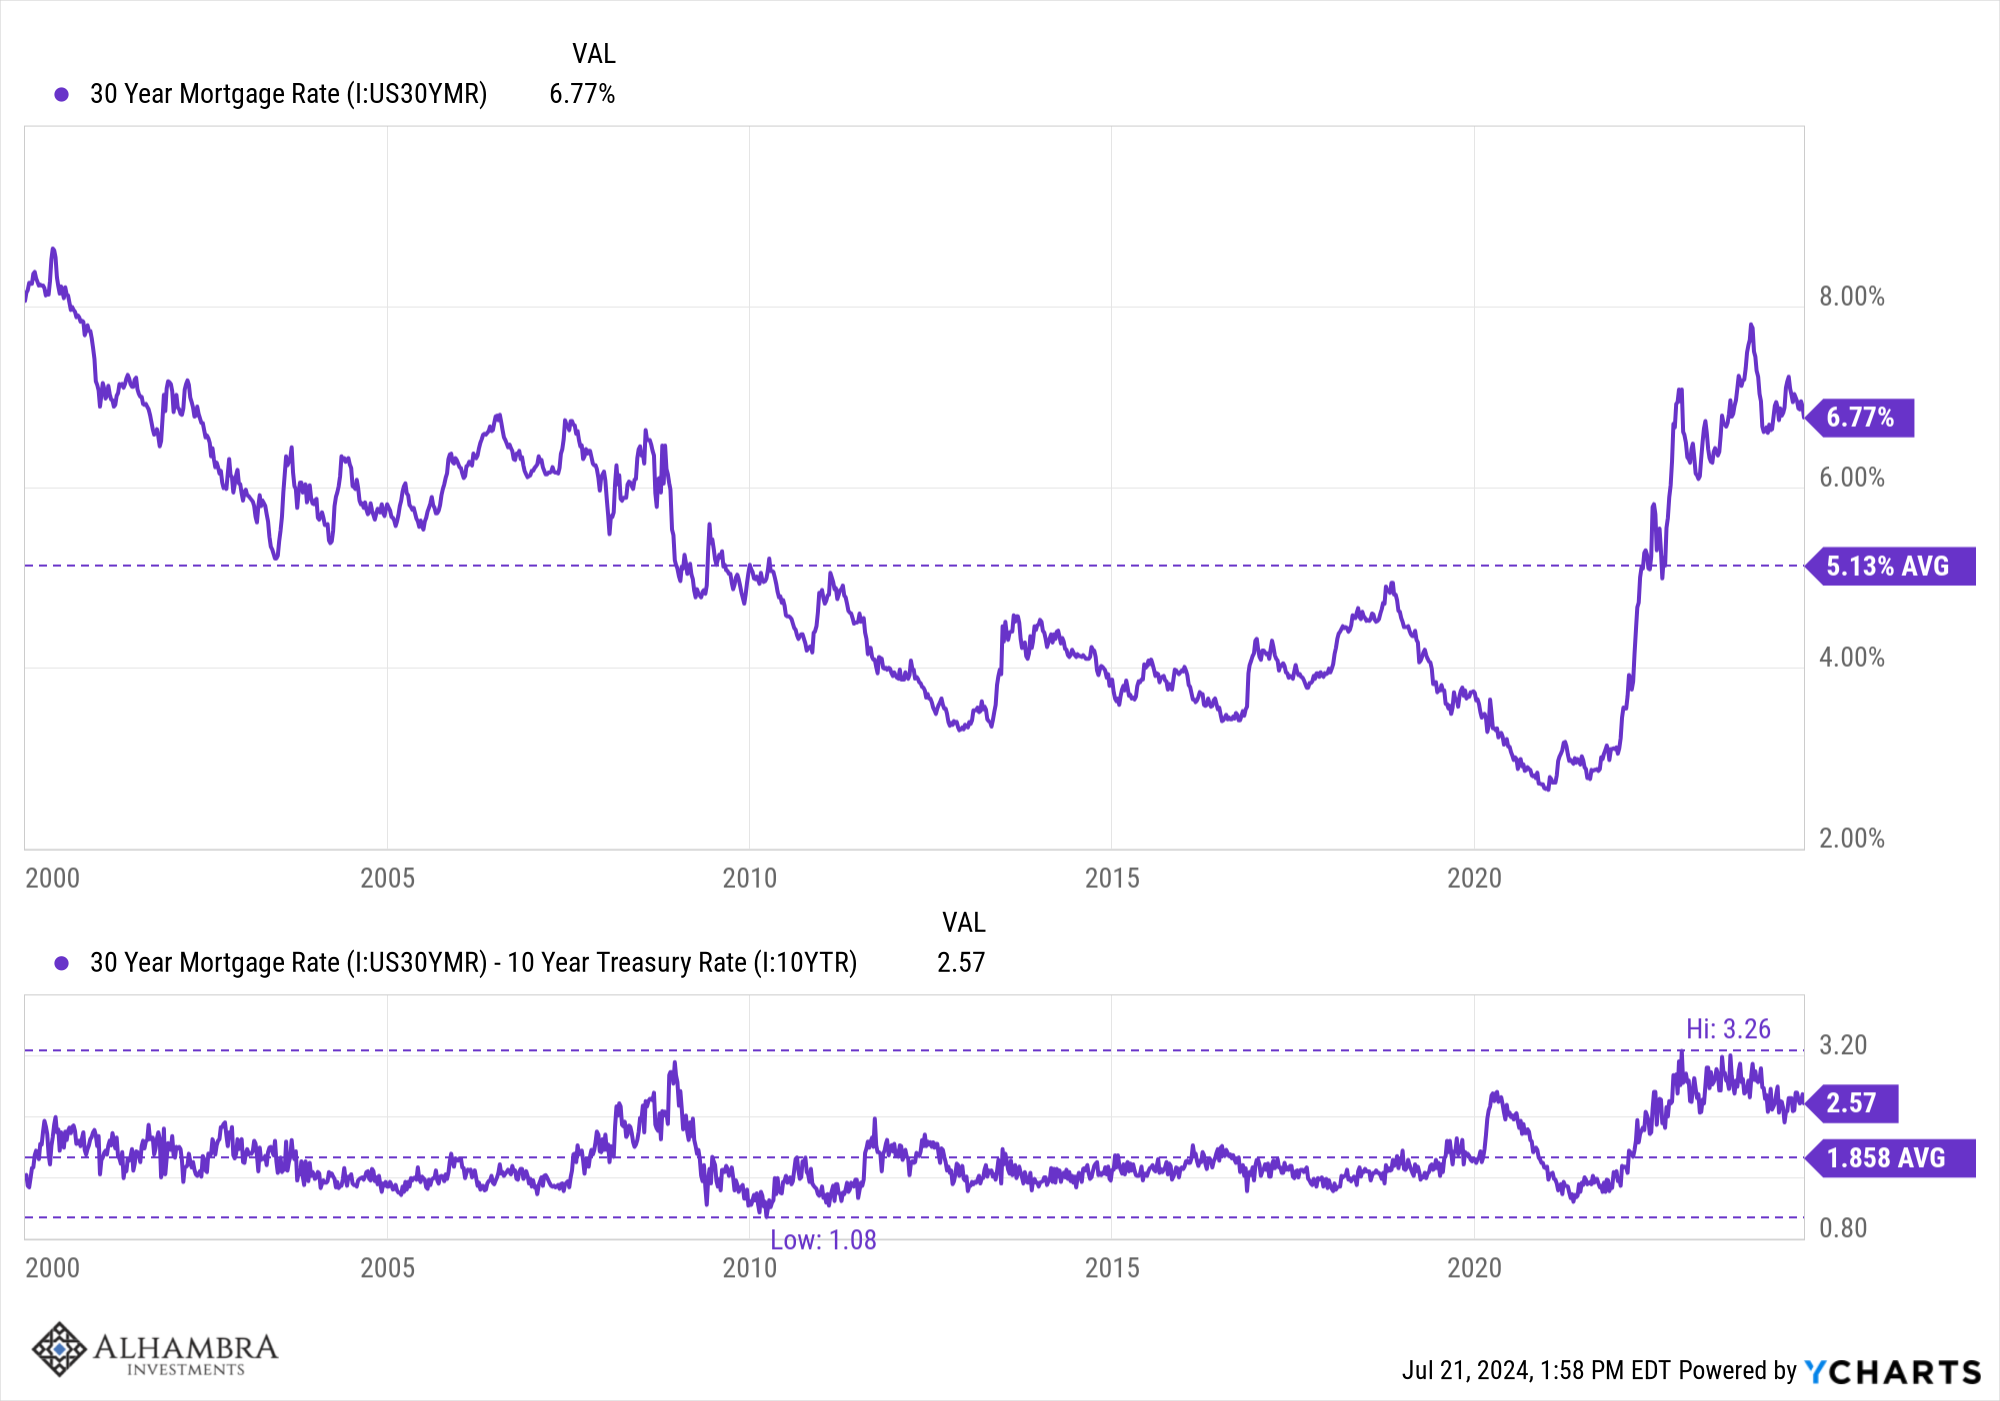
Mortgage rates have already come in by 70 basis points and getting to the average spread would drop rates another 70. Add 0.75% from Fed rate cuts and you get a rate that is very near the longer term average of 5.1%. The obvious implication is that activity picks up and that seems likely. But we can’t predict the exact impact on supply and demand and prices. Lower mortgage rates will probably increase supply because going from the 3% to 5% isn’t as much a shock as nearly 8%. But how much? I have no idea. Likewise, lower rates seem likely to increase demand but what if it increase faster than supply and prices rise more? So, yes more activity seems likely but how much is hard to say.
Real goods consumption is back above the April 2021 peak (Biden’s first stimulus bill) but is essentially unchanged since September last year, nine months ago. We are, however, starting to see evidence that production is already ramping up. Last week’s industrial production report was much better than expected as was the manufacturing component of that report. Manufacturing production rose at a 4% annualized pace in Q2 which was a lot better than Q1 when it saw almost no gain at all. The Philly Fed manufacturing survey offered further evidence with a reading of 13.9, much better than the expected 2.9 and the sixth monthly rise in a row. Within that report business conditions, employment, new orders and prices paid all improved. Future activity readings rose from 13.8 to 38.7.
Goods production was going to need to rise regardless of interest rates because of low inventories. If the Fed cuts rates in September – and they have certainly built expectations for a cut – the extra demand from increased housing activity may see the market start to doubt the need for more cuts before the end of the year. To bring this back to the market, if the moves over the last two weeks are only about the potential for lower interest rates, then pricing out those extra rate cuts would probably be painful. If the recent moves are more about growth, then it won’t matter as much. It may be that the market has become too optimistic about Fed rate cuts just as it did earlier this year when it priced in 7 cuts for 2024. Fewer rate cuts doesn’t have to be a bad thing for investors as long as the reason for it is better than expected real growth and not worse than expected inflation.
The economy has repeatedly surprised conventional wisdom over the last few years and I suspect it isn’t done yet. There are plenty of other indications that economic activity is continuing and, in some areas, increasing. Earnings growth is expected to broaden out beyond the big tech stocks over the next three quarters and CEO confidence is rising. It may have been a better than expected inflation report that kicked off this rotation but it may be better than expected growth that keeps it going. Has Goldilocks entered the conversation?
Environment
(Click on image to enlarge)

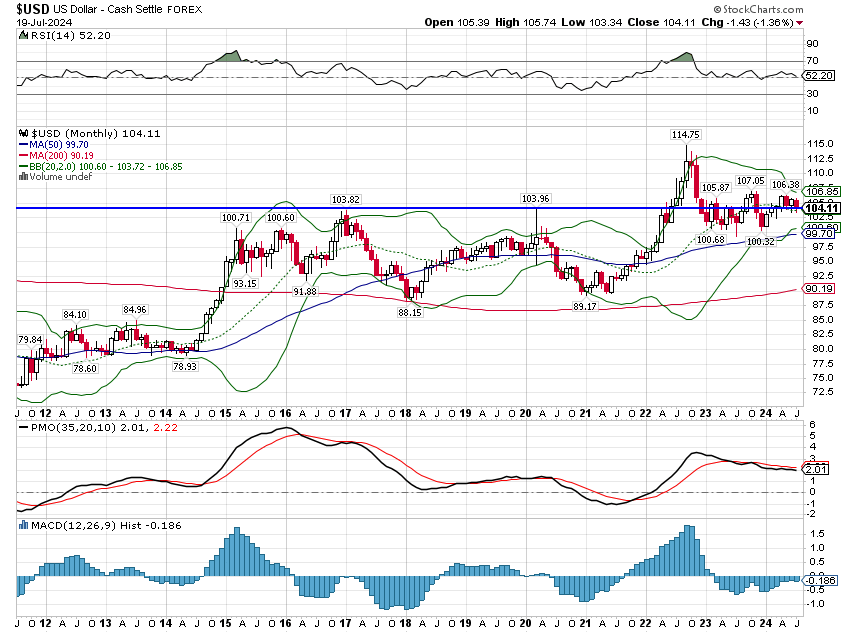
The dollar is barely changed over the last year and while it is in a short term downtrend the fact is that it has been remarkably stable versus other currencies since 2017. It has traded down to around 90 and up to as high as nearly 115 but most of that time was spent between 90 and about 105, a range of roughly 15%. Against other currencies the dollar has been stable.
(Click on image to enlarge)
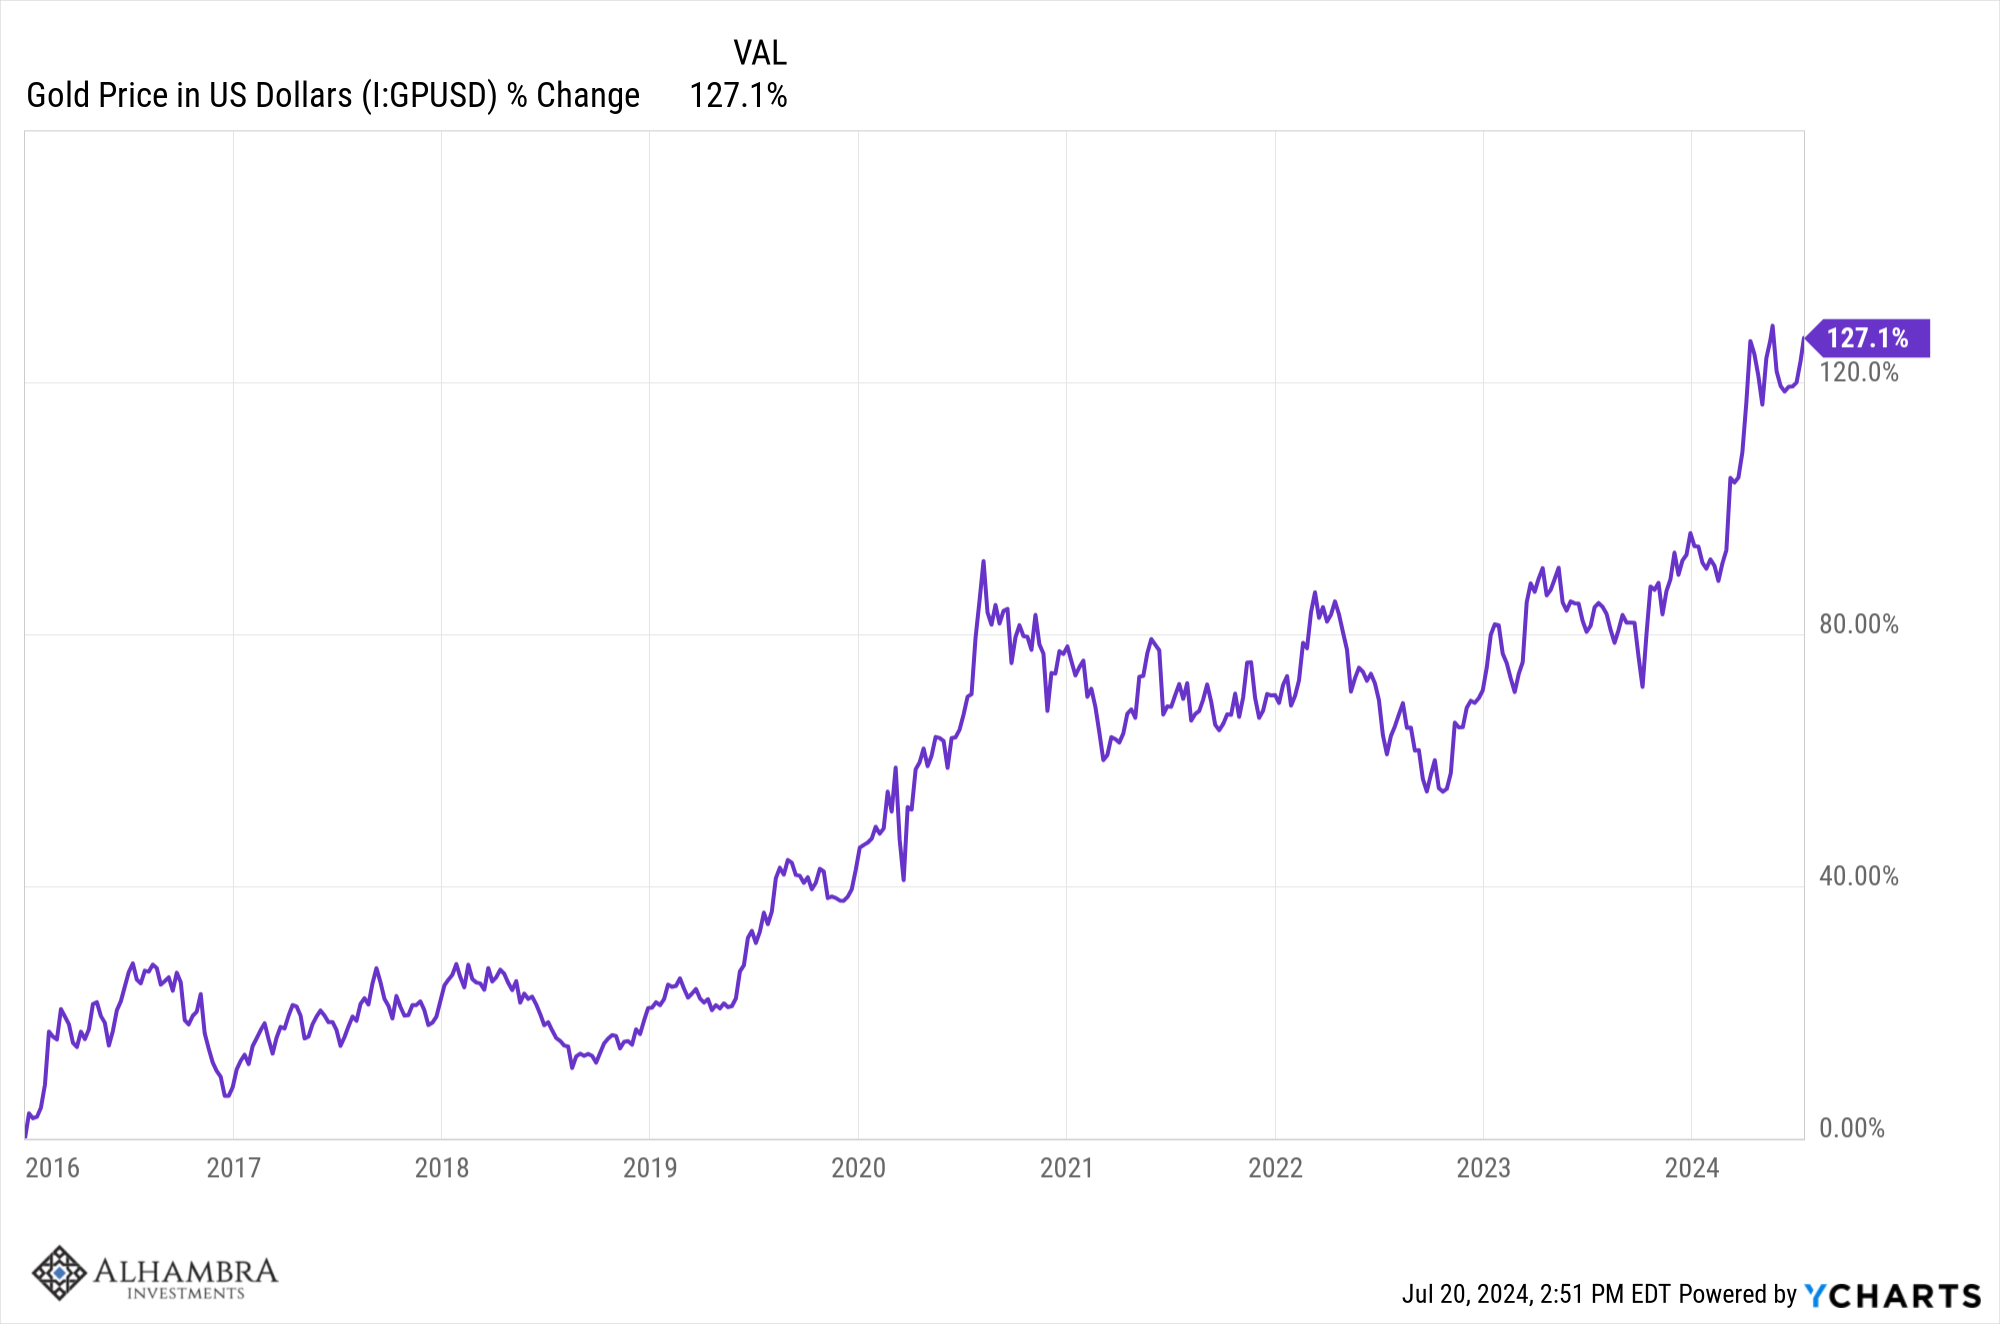
What is – arguably – more interesting is the value of the dollar versus gold. The dollar has been steadily devaluing against gold since the turn of the century while the dollar index is basically unchanged over that near 25 year period. That means that the other currencies in the DXY have also been devaluing against gold. I’m no gold bug but it is extraordinary to me that an inert metal with few industrial uses has outperformed the S&P 500 by such a wide margin over the last 25 years. It doesn’t produce any cash flow and it isn’t productive and yet it has gained more in value than the 500 largest and best companies in the US if not the world. Should we call this inflation? It doesn’t seem like it because we haven’t seen other prices rise so much. But it does say something about how people feel about the economy; you don’t buy gold if you think you have better alternatives.
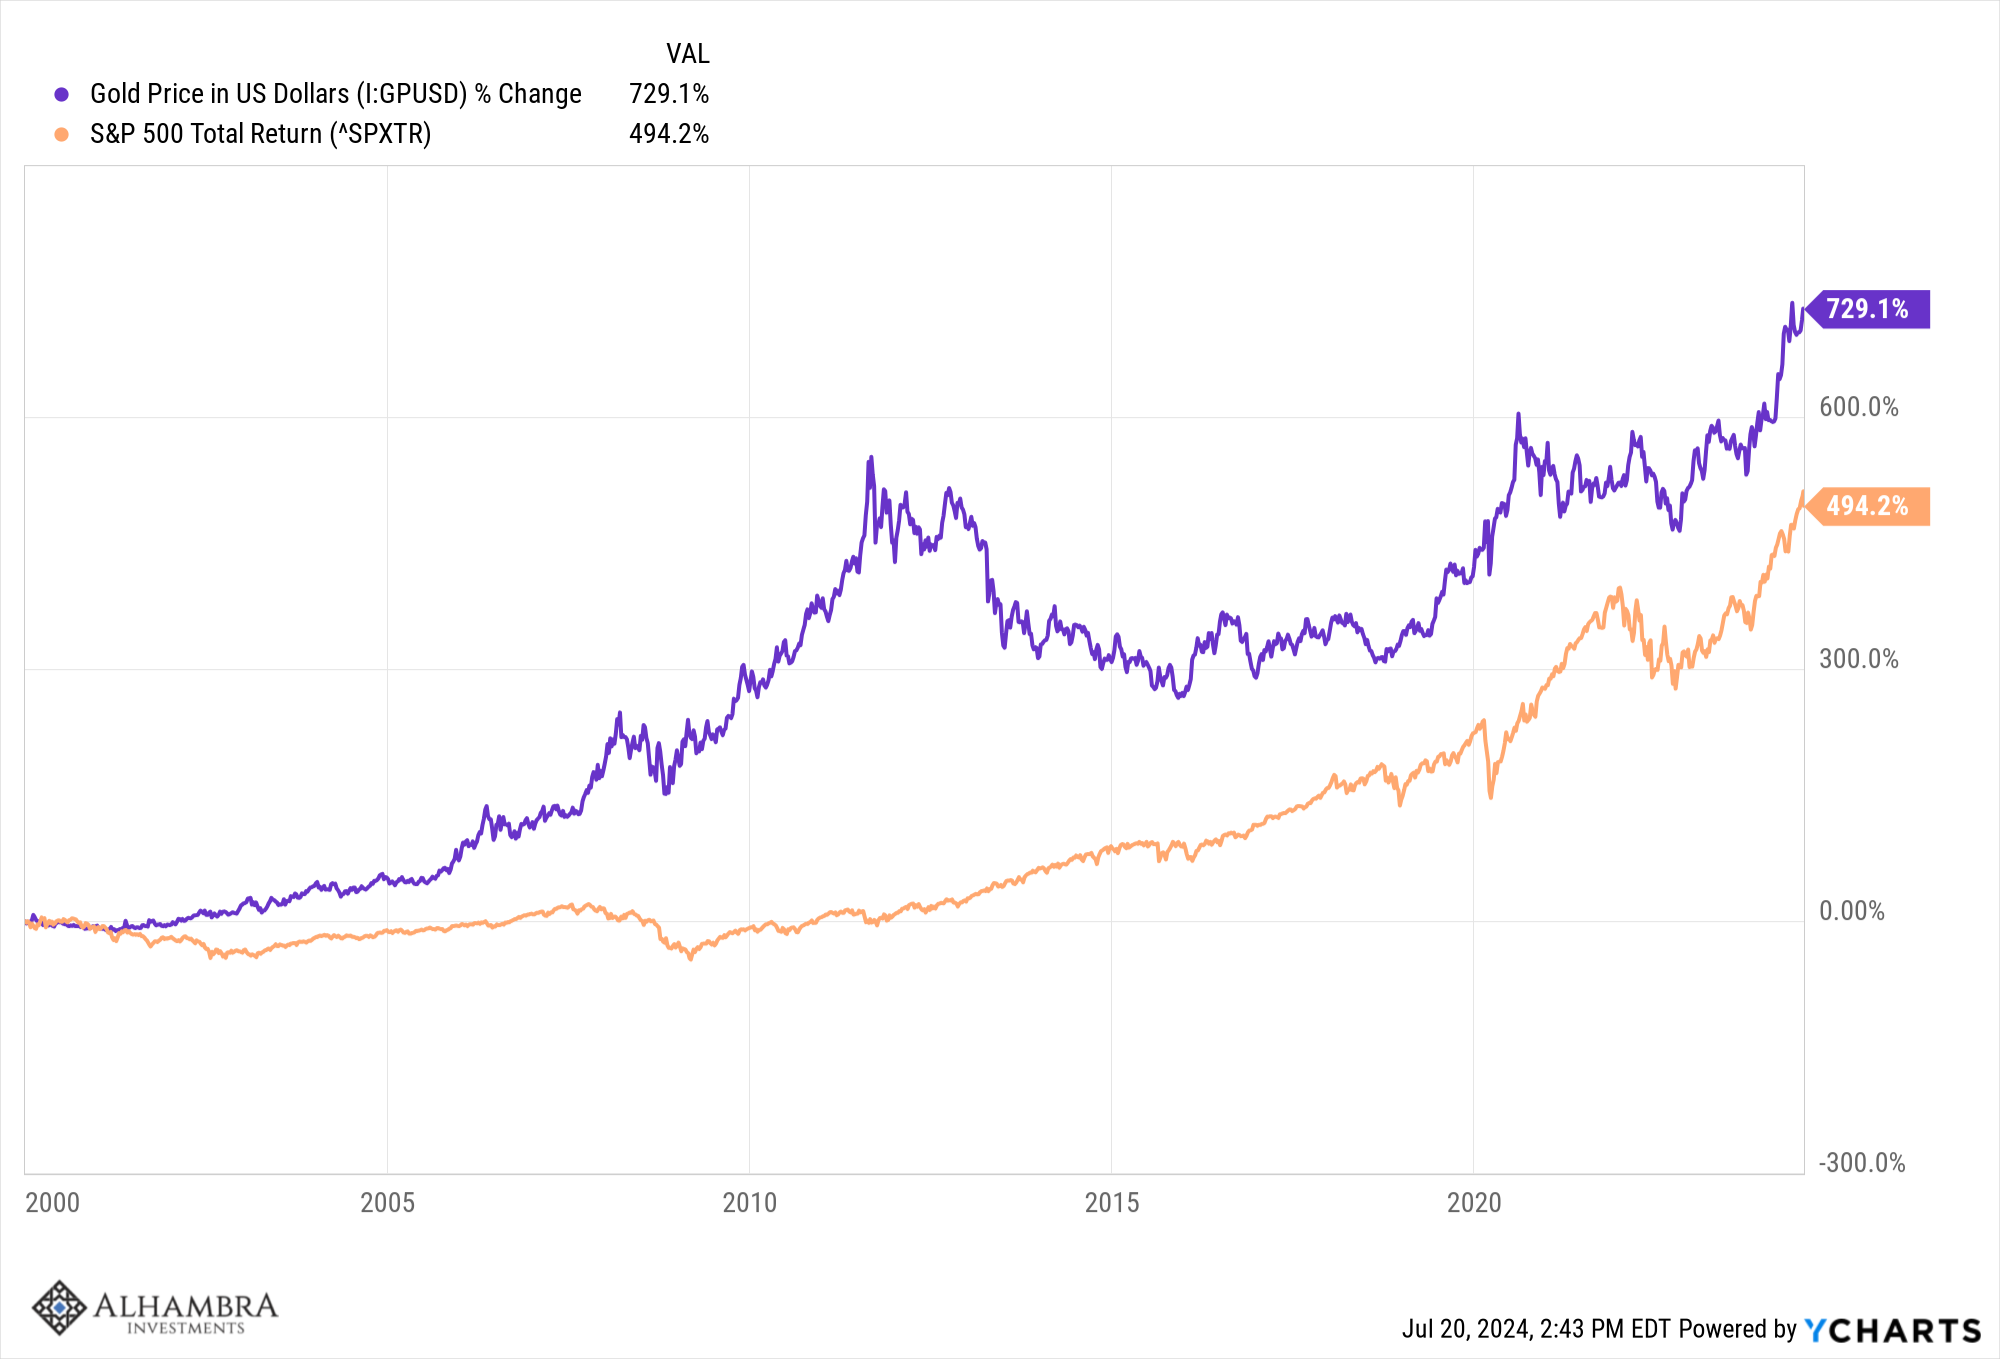
Gold has more than doubled in price since 2016 so whatever has been driving the price up since the turn of the century, it continues unabated. Is there one policy we can point to as the cause? Probably not. Does it harm the economy? To some degree, but how much is impossible to say.
The 10 year Treasury rate continues to trend sideways as it has for almost two years. It appears to have peaked for this cycle and a reasonable downside target would be around 3.25%. If that proves accurate, it would likely mean a very mild – or non-existent – recession.
(Click on image to enlarge)
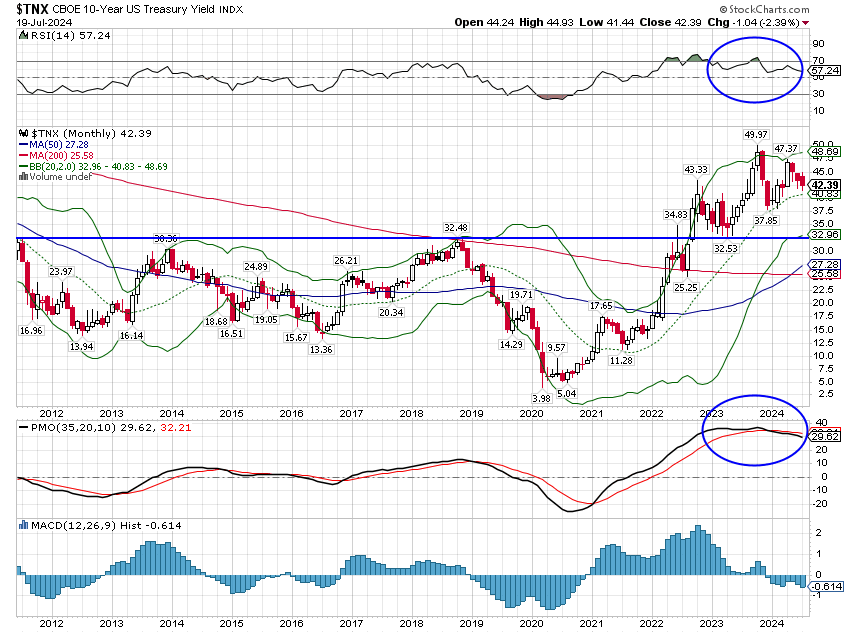
For now, the 10 year rate and the dollar are both in short term downtrends. My view is that the short term downtrend in rates is just that – short term and destined to turn into a long term uptrend. The dollar, on the other hand, seems more likely to enter a weak phase as the US continues to run large budget and current account deficits.
Markets
All the major asset classes we include in our portfolios are up for the year now, something we haven’t seen in quite a while. Despite the correction of the last week, large cap growth stocks continue to lead but with just one week of outperformance, large cap value stocks have regained the lead over the 3 year time frame. I believe that is a long term trend that will persist for at least a few more years. Changing a trend after it has been in place for such a long time, like the outperformance of large cap growth, takes time but it is happening finally. Yes, this year is frustrating but expand your time frame and you’ll see that over the last 3 years value has reached the same destination as growth with a much smoother ride.
Over the last month it has been interest rate sensitive sectors – small caps and REITs – leading. That can continue as well but only as long as recession is avoided.
(Click on image to enlarge)
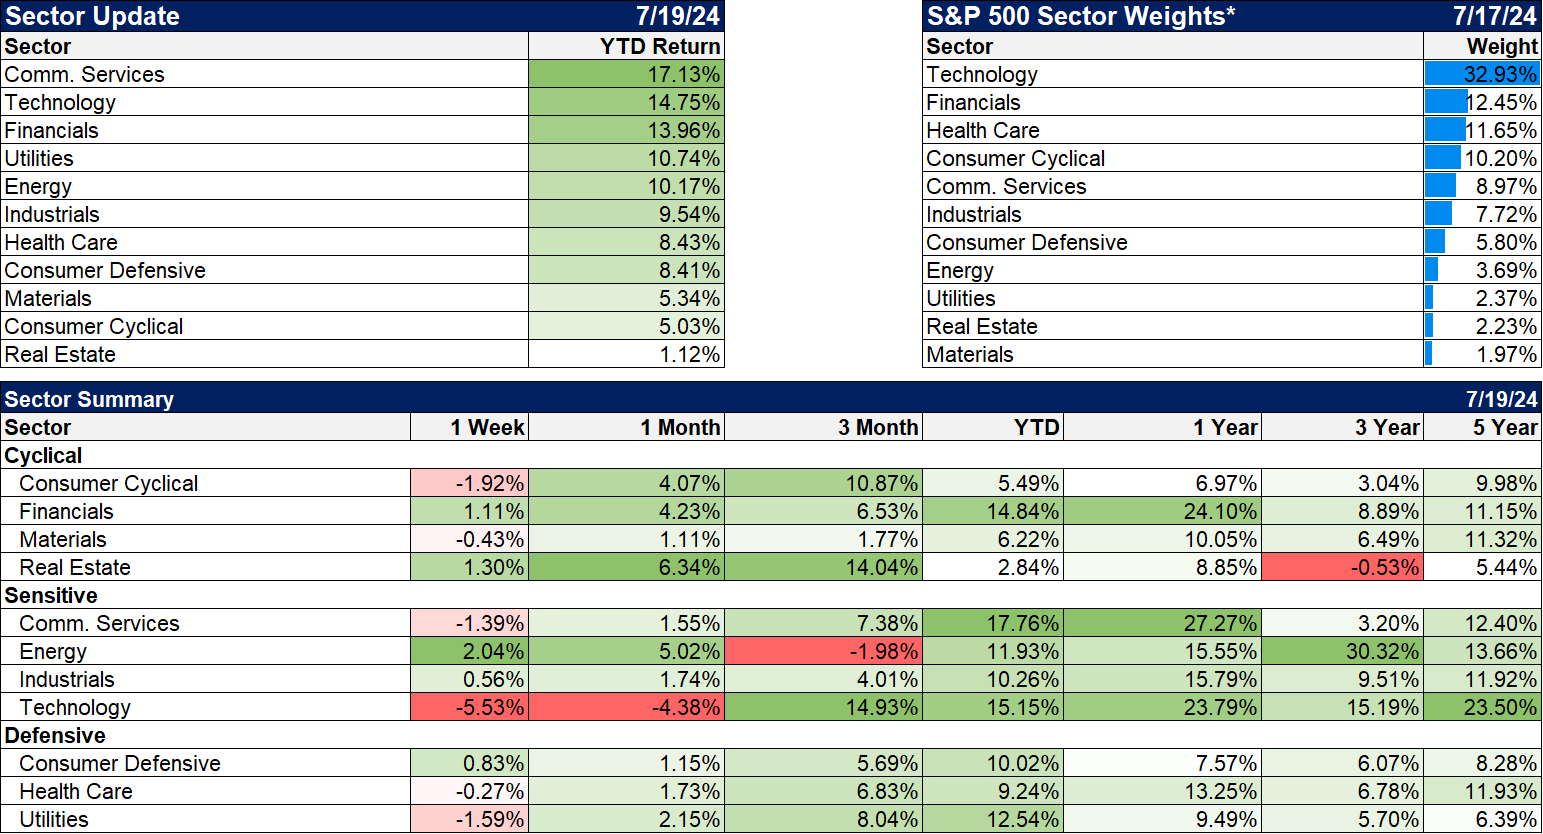
Sectors
Tech stocks are finally taking a breather and this earnings season is likely to prove very exciting for the sector. Expectations are sky high and just meeting those expectations probably won’t be enough to keep the sector rising. Other sectors are expected to see earnings start to improve this quarter and really accelerate in the second half of the year. That means guidance will be the key rather than just Q2 earnings.
(Click on image to enlarge)
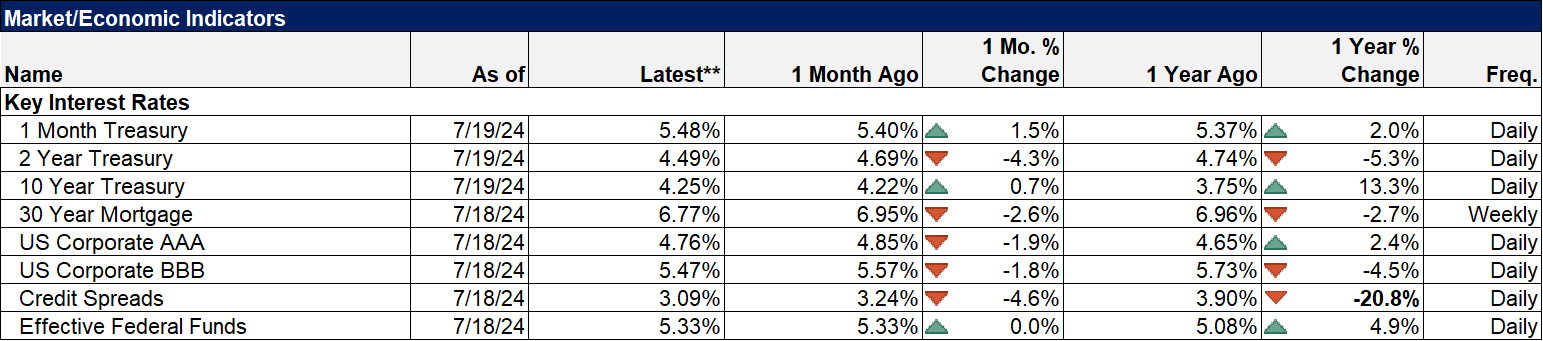
Market/Economic Indicators
Over the last few months, economic data has routinely come in less than expectations but the last couple of weeks have seen that start to be reversed. Last week was no exception and it looks to me as if the goods side of the economy is slowly recovering from its 2 year malaise.
- The Empire State manufacturing survey was -6.6 in June, slightly less than the expected 6 but this survey hit it nadir in January and has been steadily improving since. New orders were stable, shipments increased, delivery times improved and inventories fell.
- Retail sales were flat in June but part of that was due to a slowdown at auto dealers from a systemwide software issue (not Crowdstrike). Ex-autos, sales rose 0.4% and ex-autos and gas they were up 0.8%
- Retail inventories ex-autos were flat in May (latest figures); the retail inventories to sales ratio is falling
- Building permits and housing starts were both better than expected in June. The rise was driven by a surge in multi-family starts. I have a more detailed view of this report at MyPersonalCFO: Do Homebuilders Have An Inventory Problem?
- Industrial production rose 1.6% in June, much better than expected. Manufacturing production was up 0.4% and 4 of the last 5 months.
- The Philly Fed manufacturing index rose to 13.9 versus expectations of 2.9. This index is up 6 months in a row. Shipments, new orders and employment all turned positive. Future activity expectations rose from 13.8 to 38.7.
Credit spreads are back near their lows for this cycle.
(Click on image to enlarge)
More By This Author:
Weekly Market Pulse: The Soft Landing Zone
The Fed Gets Its Wish
The S&P 500 Rules Everything Around Me


Comments
Log in or sign up to join the conversation.