
Weekly Market Pulse: The Soft Landing Zone
At first glance, the inflation reports last week seemed pretty boring. The Consumer Price Index actually fell in June by 0.1% but the year over year change was still 3%, a full percent higher than the Fed’s target. Core CPI was up 0.1% for the month. Both were positive surprises with the consensus expecting a rise of 0.1% for the headline and 0.2% for the core reading, but it wasn’t that far from what was expected.
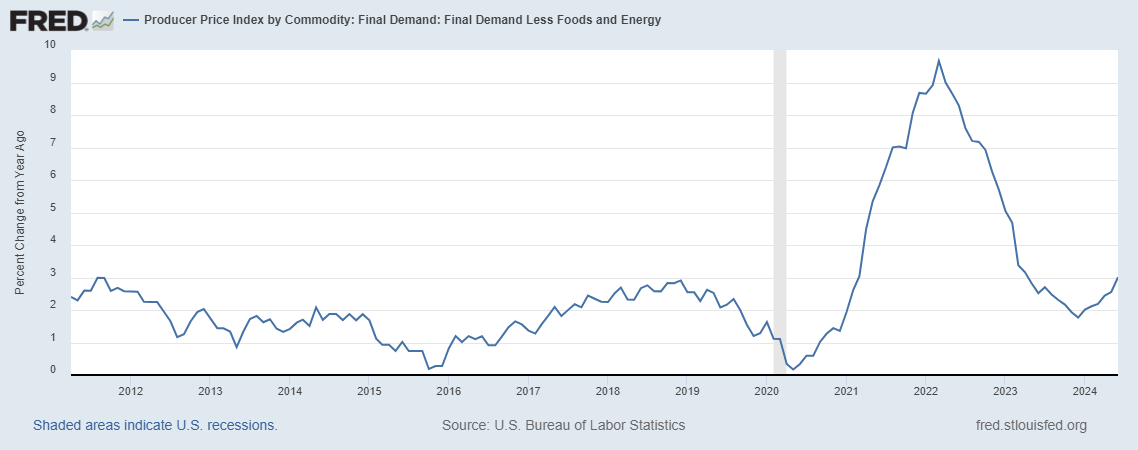
The Producer Price Index, on the other hand, was a negative surprise with a headline reading of +0.2% and a core reading of +0.4%, higher than the expected +0.1% and +0.2% respectively. Furthermore, the year over year readings came in at 2.6% and 3%, up from 1% and 1.75% at the beginning of the year. PPI readings tend to be more volatile than the CPI but those are pretty obviously moving in the wrong direction. But, like the CPI wasn’t that positive, neither was the PPI that negative.
(Click on image to enlarge)
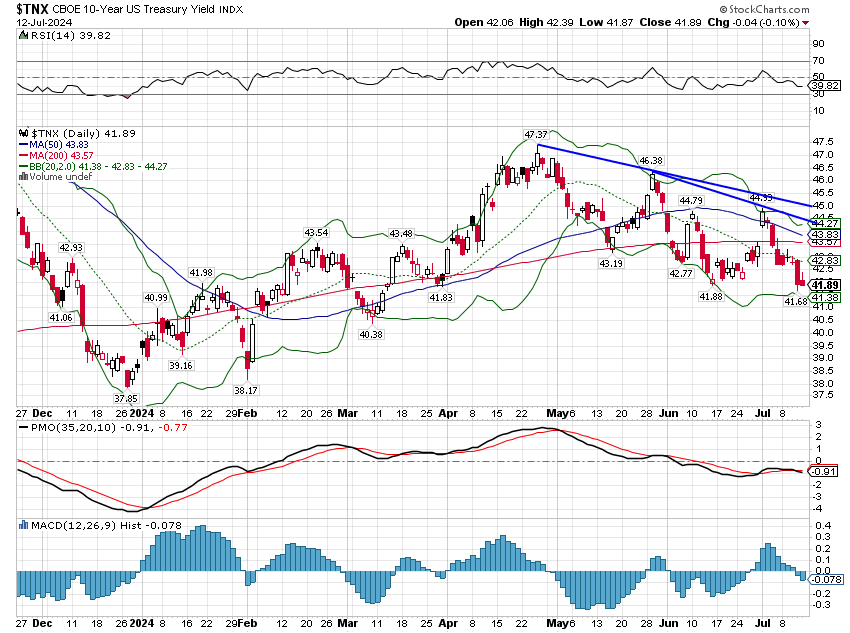
With that as background I think the reaction of the bond market was appropriate with the 10 year yield falling roughly 8 basis points on the week. The reports were a mild positive and the bond market reaction was also mildly positive. Money markets took this as a bit more positive with expectations for a Fed rate cut in September rising to about 90% from 74% earlier in the week and the odds of a cut in November rising above 50%.
The response in other markets though was much more extreme. On Thursday, after the CPI report, the S&P 500 fell 0.9% on the day as the large tech stocks that have been leading the market were taken to the woodshed. Nvidia, the AI darling, fell 5.6% on the day and most of the tech names in the top 10 holdings of the index were down over 2%:
(Click on image to enlarge)
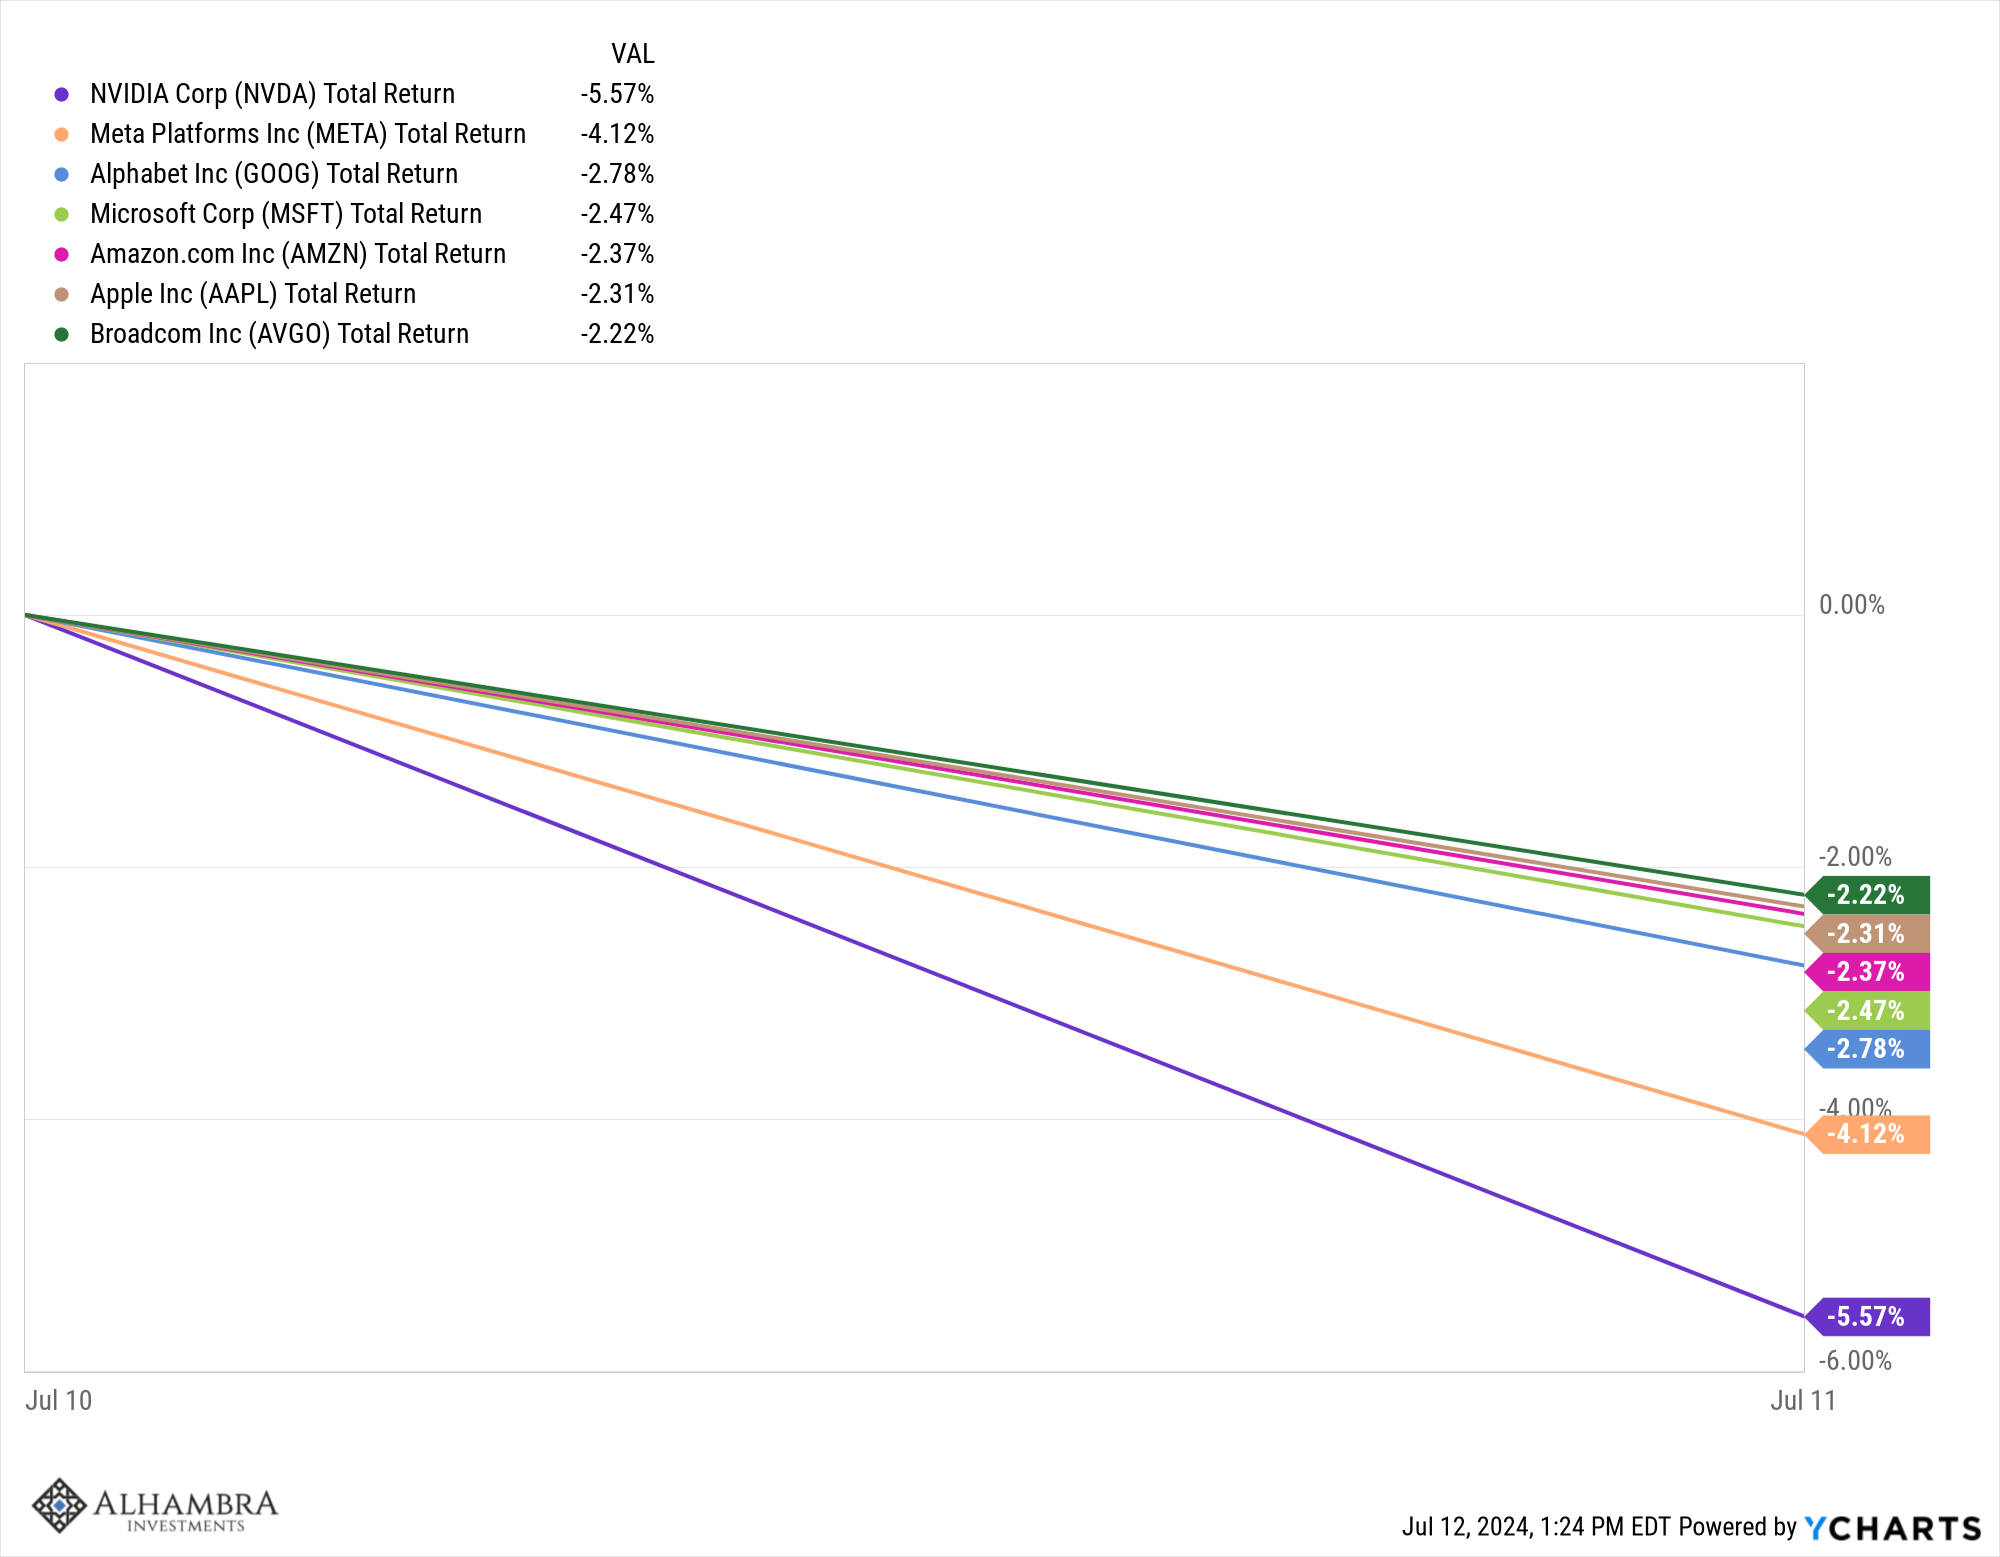
Those top 10 names have been leading the index higher all year while the rest of the stocks in the index have lagged badly. In the just completed second quarter the average stock in the index was down over 2% while the index itself rose almost 4.5%. You had to own those big tech stocks in size to make money last quarter. The YTD numbers are also skewed by the returns of those AI oriented stocks, with the index up more than double the average stock.
On Friday, after the PPI report, the big tech names recovered some, but less than 1%, while the index itself recovered all of its Thursday losses. Obviously, that wasn’t because of the mild recovery in the AI names. The difference in the performance of the index versus those big tech stocks both days is found in all those other stocks that have lagged the index so badly this year. In the second quarter only 42% of the stocks in the index posted positive returns but 390 of the 503 stocks in the index finished Thursday higher and Friday 90% were positive.
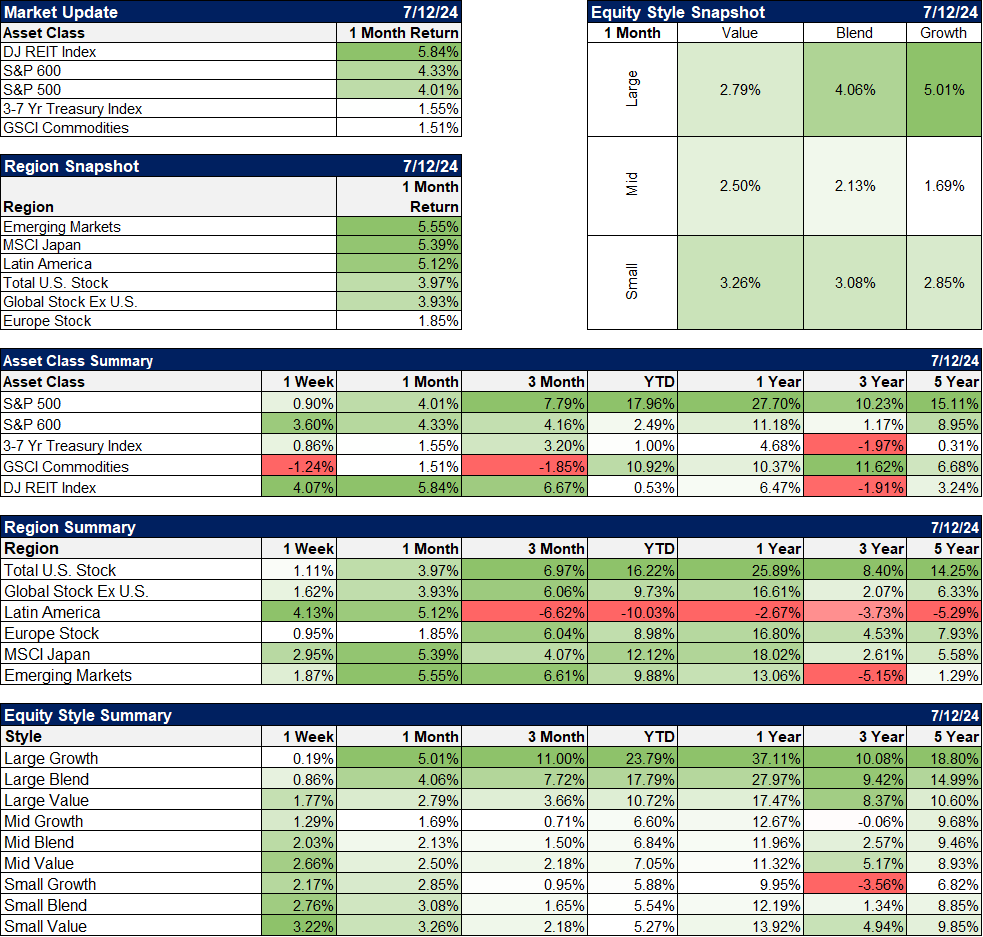
An even bigger divergence this year has been between large cap stocks and their small and midcap cousins. Small caps were down 3.4% in the second quarter while midcaps fell 2.8%. At the end of the quarter their YTD returns were 2.9% and 6.2% versus the 15.3% of the large caps (S&P 500). Thursday small caps were up 4.1% and midcaps were up 3% with small caps posting their biggest one day outperformance of large caps since October of 2008, which tells you that follow through will be critical to see if this is sustainable. We got that on Friday (and we’ll need to see more next week) and by the close small caps were up 6.2% and midcaps 4.4% for the week. YTD small caps are now up 6.2% and midcaps 9.0%. The S&P 500 is still winning but the gap is closing.
REITs also responded very favorably to the increased odds of a rate cut. At the end of the second quarter, REITs were down 4% for the year. They rose 2.8% Thursday, posted a gain of 4.8% for the full week and are now positive on the year.
I expect to see this broadening out of the rally to continue. The first half outperformance of technology makes some sense when you look at earnings growth.
(Click on image to enlarge)
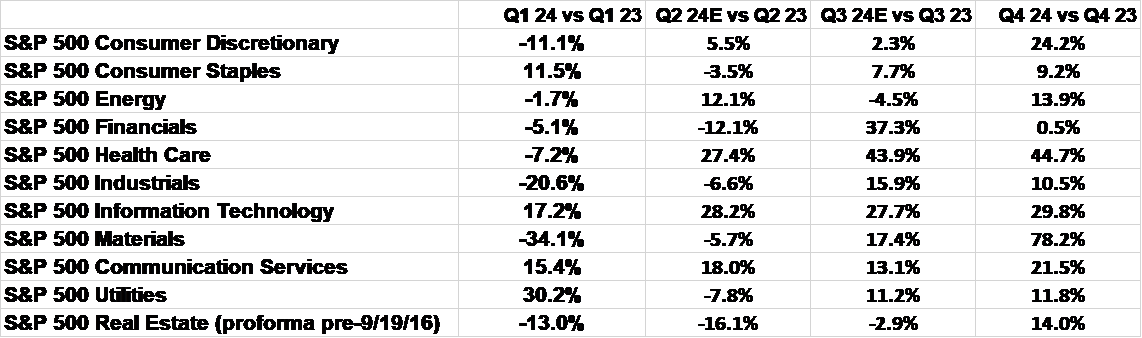
Technology, Communications Services and Utilities (all AI related) earnings were, by far, the biggest gainers in the first quarter of the year. 7 of the 11 sectors saw earnings contract in Q1 24 vs Q1 23. The rest of the year though looks a lot different (assuming estimates are close to accurate). Q2 earnings, which we are starting to be reported now, will show some improvement with energy and healthcare also posting earnings gains. I would also note that we haven’t seen the normal confession period we see near the end of a quarter. Usually, the last couple of weeks of the quarter see companies warn about missing current estimates and analysts adjust their numbers down before the reporting starts. That sets up the usual “better than expected” reporting we see just about every quarter. But that hasn’t happened this time as estimates are down less than 1% during the quarter. That bodes well for this earnings season.
The second half of the year looks even better with 9 of 11 sectors expected to post gains in Q3 and all sectors expected to report gains in Q4. Assuming the economy holds up to the end of the year, the second half could prove very interesting for the S&P 493.
And I guess that is the wild card. I think what really excited markets at the end of the week was not just the drop in the headline CPI. More important for the Fed is the core reading which continues to drop pretty rapidly.
(Click on image to enlarge)
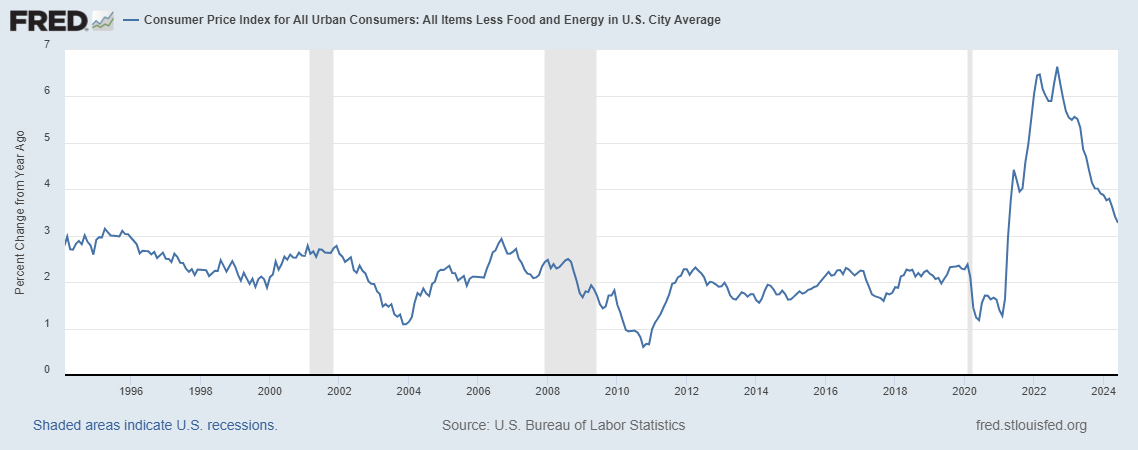
Also having an impact was the rise in the Atlanta Fed’s GDPNow estimate for Q2 GDP back to 2% after falling to 1.5% the previous week. It recovered based on nothing more than a rise in wholesale inventories – which could be positive or negative – but most people just look at the headline. The University of Michigan consumer sentiment report also showed a drop in inflation expectations to 2.9%.
What all that adds up to is that expectations for an economic soft landing are rising. I have no idea whether those expectations will be met – history says the odds are against it – but for now any evidence in favor will affect markets positively. We’ve entered the soft landing zone.
Environment
(Click on image to enlarge)

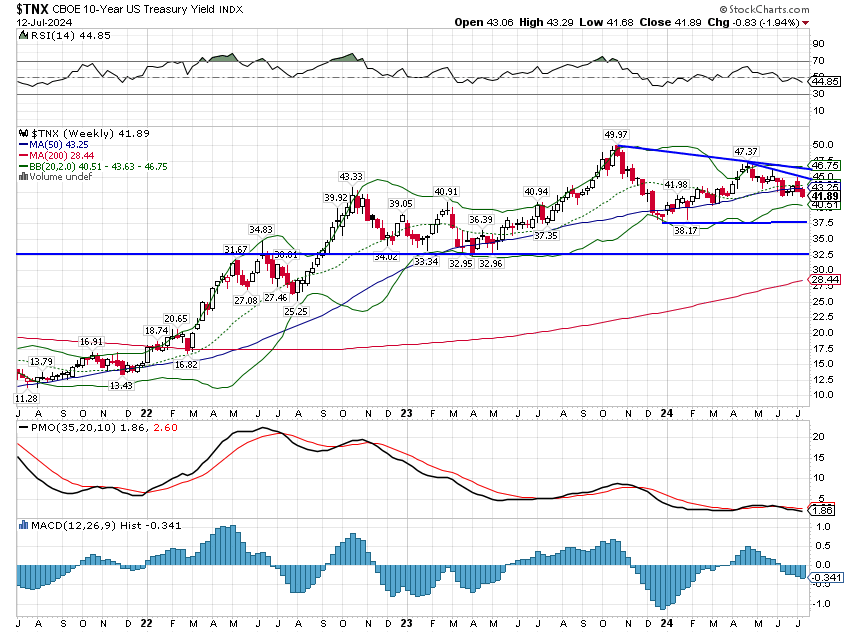
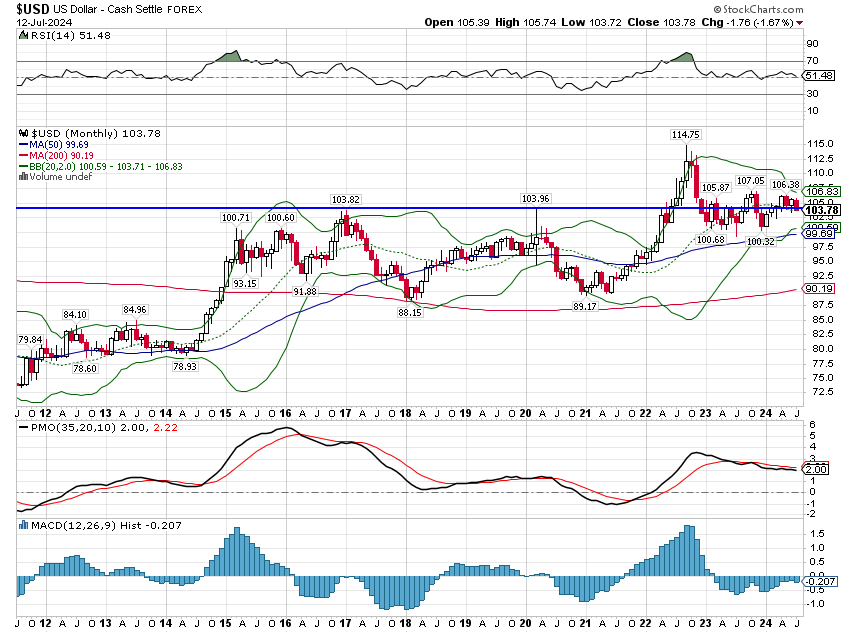
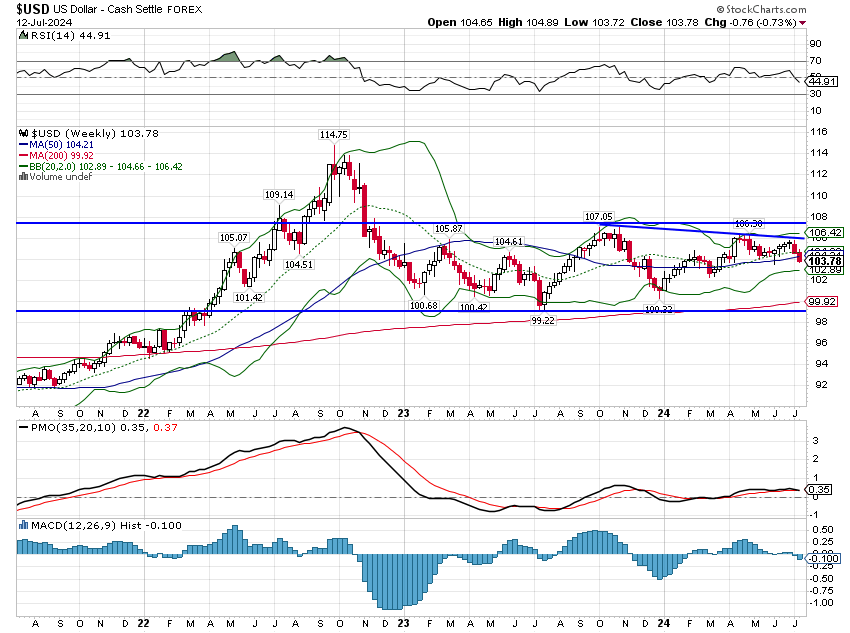
The short term downtrends for the 10 year Treasury yield and the US dollar index have accelerated over the last 2 weeks. The 10 year yield is now lower than the October 2022 peak of 4.33% and the dollar is now down over the last 2 years. The dollar actually closed trading on Friday below the early 2017 and 2020 peaks of 103.82 and 103.96. While I think these short term downtrends have more to go both are a bit stretched at the moment and could easily see a near term rebound. The intermediate term trends are still pretty neutral.
(Click on image to enlarge)
(Click on image to enlarge)
(Click on image to enlarge)
(Click on image to enlarge)
Markets
REITs have assumed the leadership over the last month along with small cap stocks but every major asset class we follow was up. International markets were also higher with EM leading the way. All of these trends are being driven by the short term downtrend in rates and the dollar.
Growth has maintained its lead over value in the large caps but mid and small value are ahead over the last month and 3 months and have caught up on a YTD basis.
(Click on image to enlarge)
Sectors
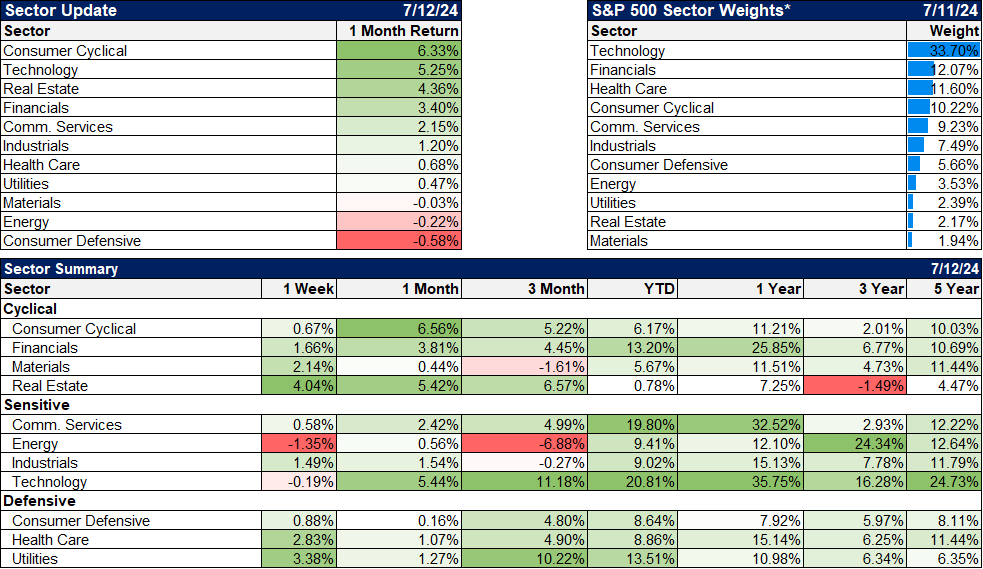
The AI mania may have cooled off a bit last week but technology, communications and utilities (all driven by AI optimism) still hold a big lead YTD.
(Click on image to enlarge)
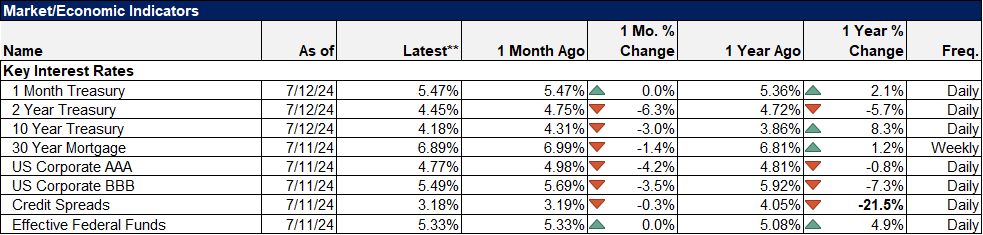
Market/Economic Indicators
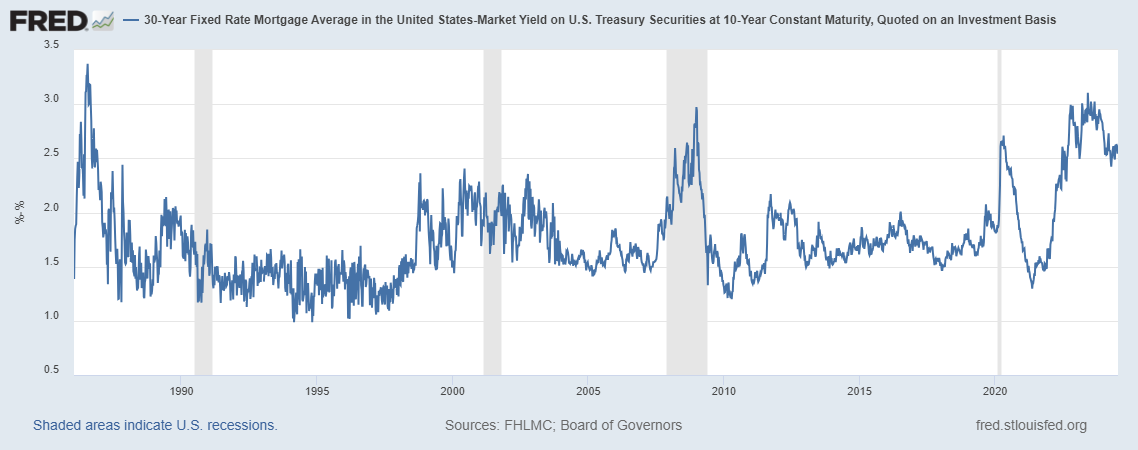
Credit spreads have fallen back toward their lows of the cycle. More importantly, mortgage rates have fallen back to under 7%. The spread between the 10 year Treasury yield and the 30 year mortgage rate is still wider than average but is working its way down from the peak around 3%. If rate cut expectations continue to build this spread should narrow. Mortgage rates could easily drop to the low 6s even with no change in the 10 year rate. If the market anticipates rate cuts though the 10 year yield will fall and mortgage rates may find their way into the 5s. That would have a profound effect on the housing market and therefore the economy.
(Click on image to enlarge)
(Click on image to enlarge)
More By This Author:
The Fed Gets Its Wish
The S&P 500 Rules Everything Around Me
Debt Service More Than Defense Spending
Disclosure: This material has been distributed for informational purposes only. It is the opinion of the author and should not be considered as investment advice or a recommendation of any ...
more

