Weekly Market Pulse: Election Anxiety

Image source: Pixabay
The election this week appears to be a tossup, the outcome dependent on how a few swing states vote. The polls, whether national or focused on a single state, show totals for each candidate mostly within the margin of error. Betting markets have been showing a more definitive leader, with all of them putting higher odds on former president Trump. The stock of Trump Media also seems to be pointing to the Republican candidate with the stock up 89% over the last month. On the other hand, the stock is down 40% over the last three days so there seems to be some doubts creeping in. In my opinion, the stock is worth $0 if he loses so there’s still a lot of money riding on a Trump win. I personally have no idea who will win and I will not be sharing my personal political views here. But I have gotten a lot of questions about investment strategy around the election and on that I will opine.
Over the last month, the dominant narrative about the markets is that the rise in stocks and bond yields has been driven by expectations of a Trump win (good for growth, bad for the deficit). While I’m sure there are some people who have bought stocks anticipating a repeat of 2016, I am always reluctant to attribute market movements to any particular source. There is rarely a single reason for a market to do whatever it does and there is no way to determine the motivations of your fellow investors. The betting markets that have emerged in this cycle offer a more direct measure but they are thinly traded and susceptible to manipulation. We know, for instance, that one large French trader has placed a series of bets on Donald Trump, on the Polymarket prediction site, that total roughly $30 million. Or at least that’s the story we’re getting from media. As with everything crypto-related, I’d take that with a huge grain of salt. I have my suspicions about what he’s really doing but I don’t have any proof so I’ll just say that I seriously doubt he’s really net long $30 million on Trump.
Nevertheless, Polymarket and other betting sites have been cited repeatedly as evidence that momentum has shifted to Trump over the last month. That alleged momentum has then been cited as evidence for the rise in bond yields and stock prices. It makes for a nice story but there is scant evidence that is actually what is going on. The most obvious problem with this narrative is that Trump’s odds of winning (as measured on Polymarket) didn’t start to rise until early October and stocks are actually down since then. Stocks are obviously up this year but to credit that all to bets on a Trump win seems a bit of a stretch. As for bond yields, they started to rise on September 18th, the day the Fed cut the Fed Funds rate by 50 basis points and again, I don’t think that has anything to do with who wins the election.
The perception that stocks and bond yields have risen based on expectations of a Trump victory could, however, have an impact on the market after the election result is known. If investors/traders believe that’s why markets have been moving and he wins, I would expect stocks to sell off and bonds to rally (rates fall). Why? It’s the old “buy the rumor, sell the news”; a Trump win is already, to some degree, priced in for those who believe his policies will produce their expected outcome. On the other hand, if Harris wins, I would expect the same directional outcome. Why? Because those Trump bettors would likely be sellers on a Harris win. It seems logical that if a Trump win is priced in that a Harris win would create more selling pressure so maybe the move is bigger if Trump loses. In either case though, any movement seems likely to be short term. And I think there is a simpler and more logical explanation for recent market moves that has nothing to do with the election.
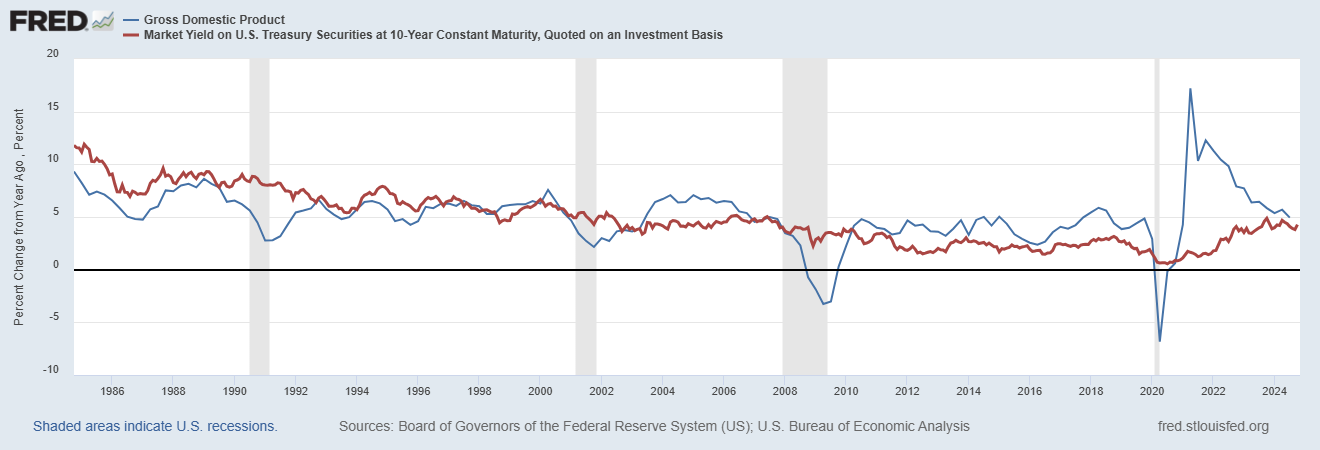
Interest rates started to rise after the Fed’s 50 basis point cut in September but why? It could be, as some have posited, that it is the market’s way of telling the Fed they’ve made a mistake, that the cut was too much in an economy that is still posting good economic growth and inflation still above the Fed’s goal of 2%. If that turns out to be the correct reasoning then you should expect rates to go a lot higher regardless of the election outcome. The fact is that a 4.4% 10-year Treasury yield isn’t consistent with high inflation. The 10-year rate is a good proxy for nominal GDP (real GDP + inflation) expectations, so 4.4% NGDP growth might be 2% real growth + 2.5% inflation or maybe the reverse. It is highly unlikely to be near an extreme in either direction, say 4% inflation and 0.4% real growth or vice versa. The rise in rates doesn’t have to be about a Fed mistake. Indeed, it may be confirmation of the opposite, that Fed policy has succeeded.
Remember, we had a growth scare over the summer. The 10-year yield was 4.48% on July 1st but fell to 3.62% by September 16th due to a series of weak economic reports. The market was at that point pricing in a sizable growth slowdown, maybe 2.5% inflation and 1% real growth. The Fed’s larger-than-expected cut in September started to change those expectations to a higher NGDP growth path. The better-than-expected employment report on October 4th raised growth hopes even higher with the 10-year yield jumping 13 basis points that day and getting back above 4% by October 10th. The employment report had nothing to do with the outcome of the election. Since then, the economic data has tracked a little better than expected and rates are now back where they started at the beginning of July; the growth scare has been fully reversed.
History tells us that, believe it or not, politics doesn’t have much impact on the economy or markets. The economy and stock market have performed well under all government configurations:

Source: J.P. Morgan (Investing In An Election Year)
Political partisanship has always had an impact on how we view the economy but in recent years it seems to have gotten more pronounced. The University of Michigan consumer sentiment poll provides us with direct evidence of this in their monthly polls. When a Democrat sits in the White House, Republicans view the economy as poor and the reverse is true as well (although not quite as pronounced for Democrats and Independents). This has affected the usefulness of the poll as an indicator about economic health but in this case it provides us with some important information about recent market movements. After the 2020 election, Republican consumer sentiment fell from 98 in October to 69.8 by January 2021. Obviously, Republicans did not expect to lose that election. Republicans have remained dour about the economy during Biden’s entire term, with sentiment averaging around a 50 reading with a low of 33 in June of 2022 and a high of 70.4 in April of 2021. This year it has ranged from a high of 67 in March to a low of 47.4 in August (during the growth scare). The last five readings were:
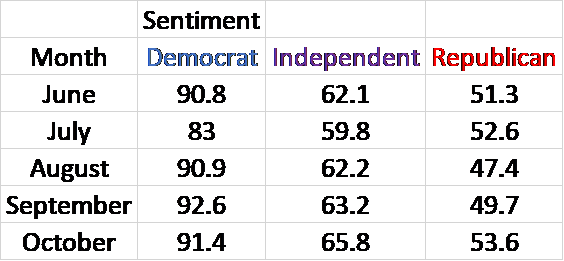
There is no indication here that Republicans are becoming more positive about the economy which I would expect if they were anticipating a Trump win.
As I said above, I’ve gotten a lot of questions recently about how to invest around the election. My answer is that you shouldn’t let your politics affect your investment strategy. Politics is an emotional activity, especially in recent years, and the last thing you want to do as an investor is let your emotions dictate your views of the economy or markets. Focus on how the economy is performing and what markets are telling us about the future. All bond yields have told us over the last two months is that expectations for growth have returned to the levels of last July. It’s just the normal ebb and flow of markets adjusting to incoming information, most of which has nothing to do with the election. Even if you had a crystal ball and knew who was going to win the Presidency and control of Congress that wouldn’t assure that you know how the markets will react anyway. You could be right about the election and still lose if you get the market reaction wrong.
Have you seen how badly the pollsters have performed over the last few election cycles? These people have forgotten more about elections than you or I will ever know and they can’t predict the outcome. What makes you think you can? I can’t either and all I can say for sure is that roughly half the country will be right about who wins the White House. A smaller percentage will also guess who controls the Senate. An even smaller percentage will guess who wins the House. An even smaller percentage will get all three right. And none of them knows how the market will react to the outcome. If you want to bet on the election, there are several legal ways to do that now. Figure out how much you’re willing to lose and go for it. Just don’t do it with your portfolio.
Environment

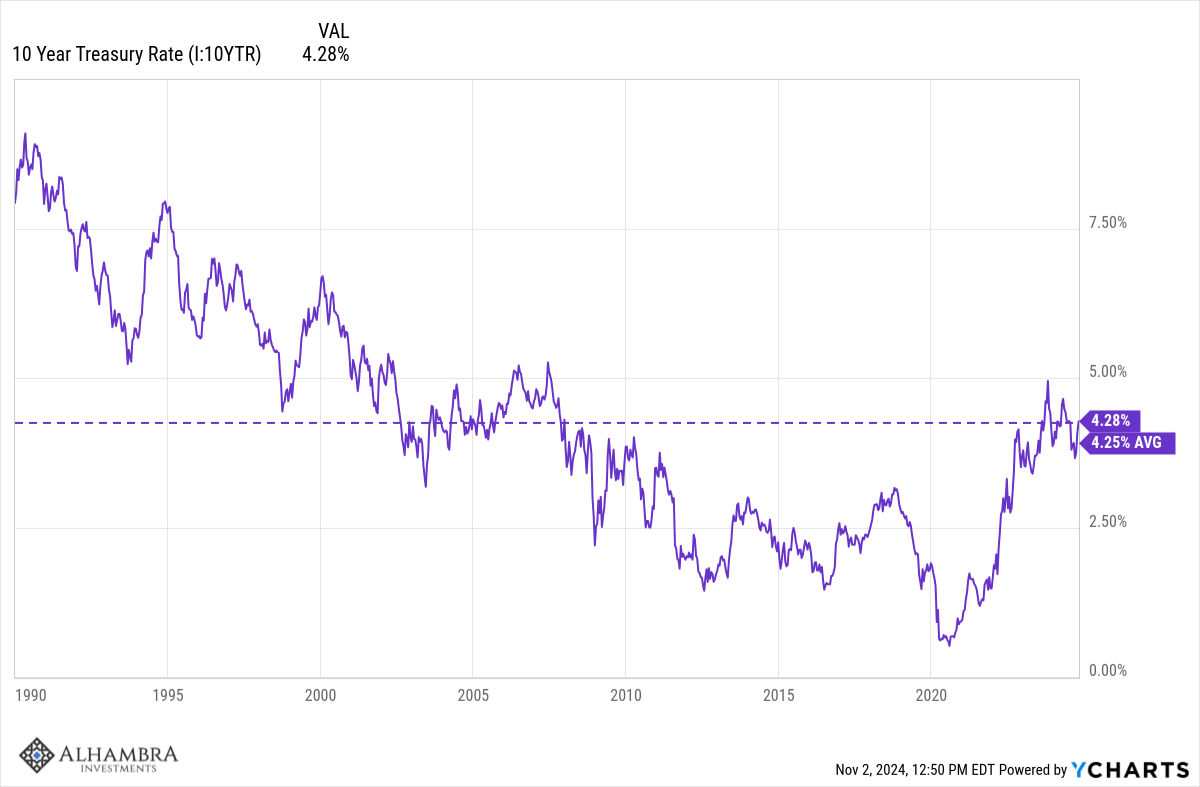
Interest rates continued to rally last week, even in the face of fairly benign economic data. Friday, after a weak employment report, the 10-year yield rose 8 basis points and closed right at the high of the day. For the week the yield rose 13 basis points and is now up 70 basis points since the Fed cut rates on September 18th. I can’t say for sure that the two are connected but it does seem consistent with the idea of a soft landing for the economy. If, prior to the Fed’s 50 basis point reduction, the bond market was pricing in a weaker economy (recession) and the Fed cut is seen as preventing such an outcome, the rise in rates makes perfect sense.
The dollar was essentially unchanged on the week although it did rise with rates on Friday. Again, I don’t see anything out of the ordinary in the action of the dollar. It is consistent with the view that the US economy will avoid recession. That view might turn out to be wrong but for now it seems quite legitimate.
Overall, nothing has changed with our two main economic indicators. Both rates and the dollar are in a trading range that has persisted for two years and is consistent with the current pace of NGDP growth released last Friday. The year-over-year change in NGDP has fallen to 4.9% and the 10-year yield as right at the average since 1990.
(Click on image to enlarge)
(Click on image to enlarge)
Markets
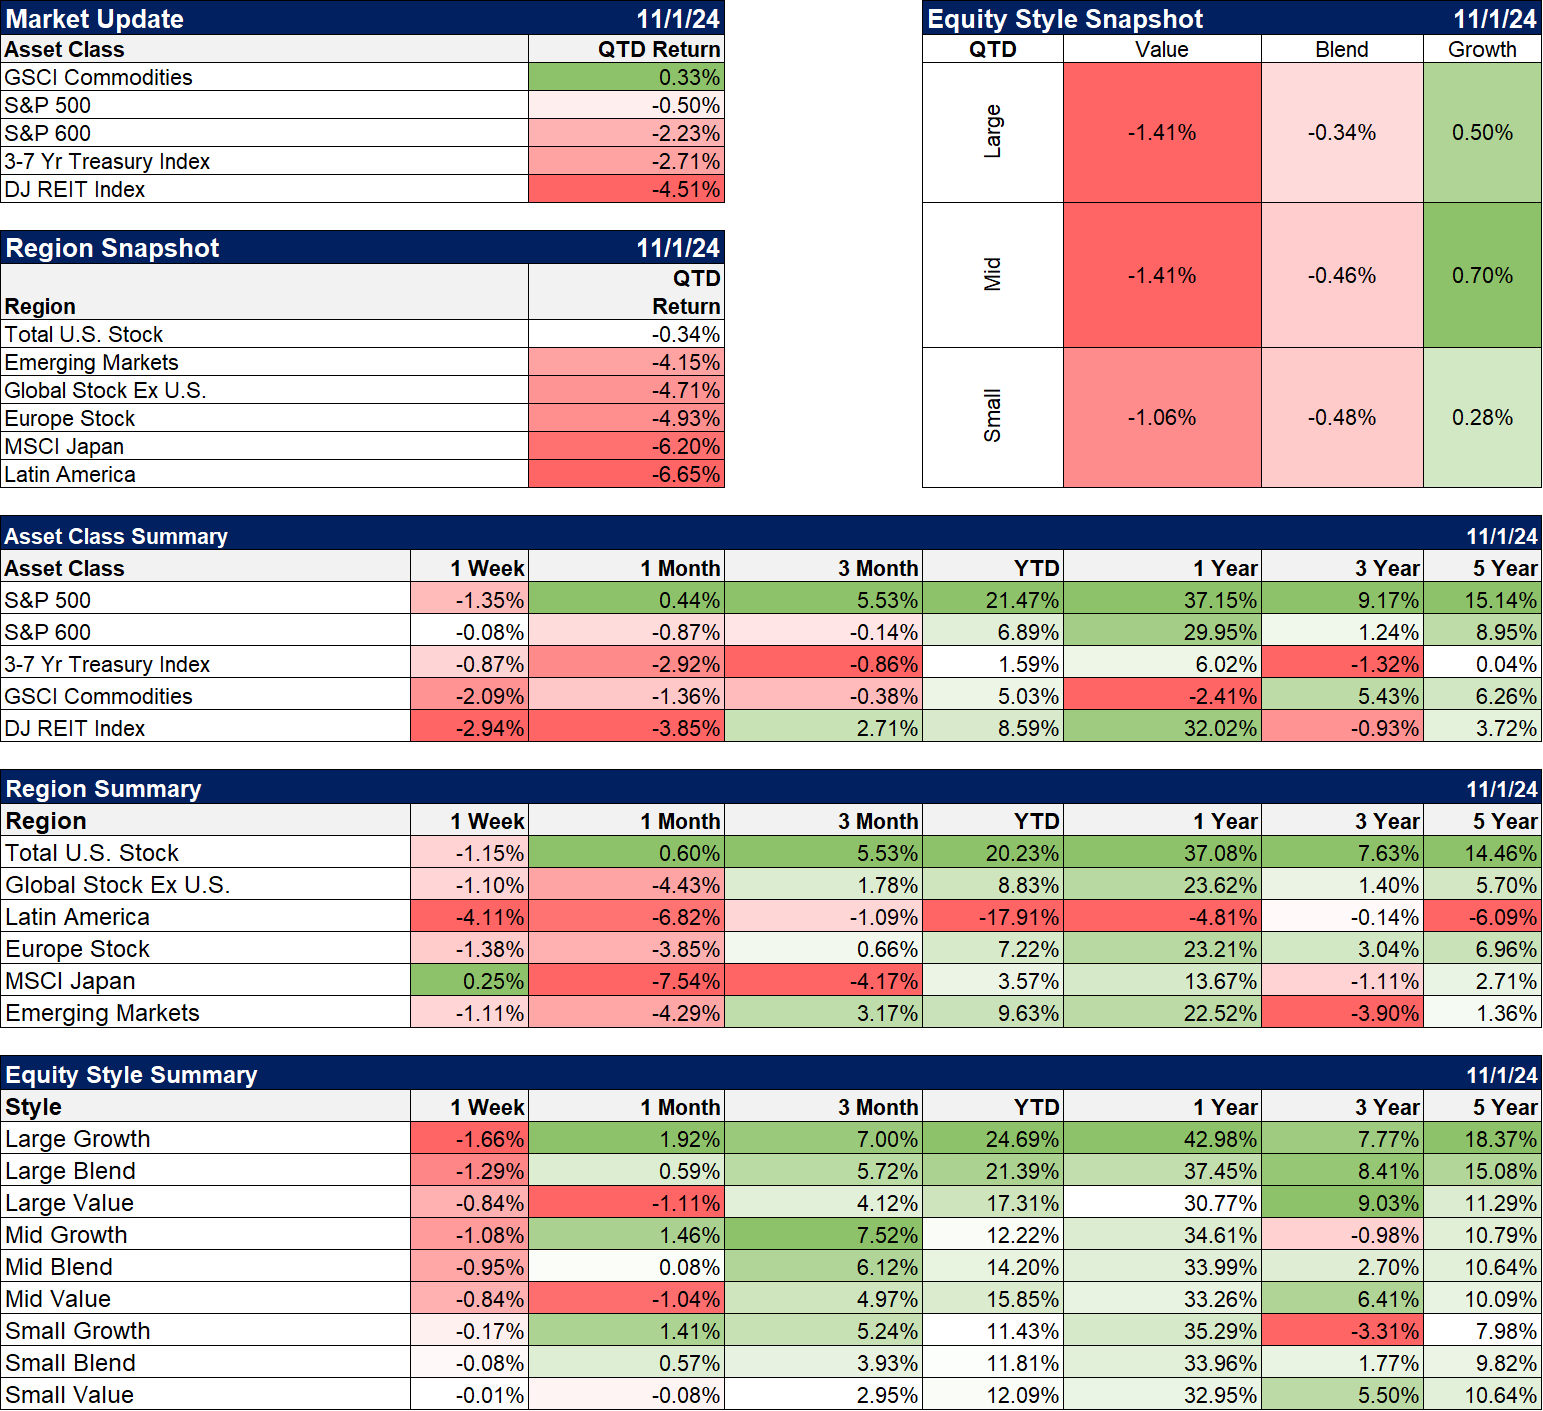
The 4th quarter has gotten off to a negative start much as it did in Q3 albeit for completely different reasons. At the beginning of last quarter, the fear was that the US economy was slipping into recession and interest rates fell about 50 basis points in July as stocks sold off (although REITs had a good month). This time the selloff is being driven by rising interest rates with the 10-year rate up 67 basis points in October. That appears to be predicated on continued strength in the economy rather than fear of inflation; 10 year TIPS yields were up 41 basis points in October. The 10-year breakeven inflation rate has only risen by 17 basis points and remains well anchored at 2.33%.
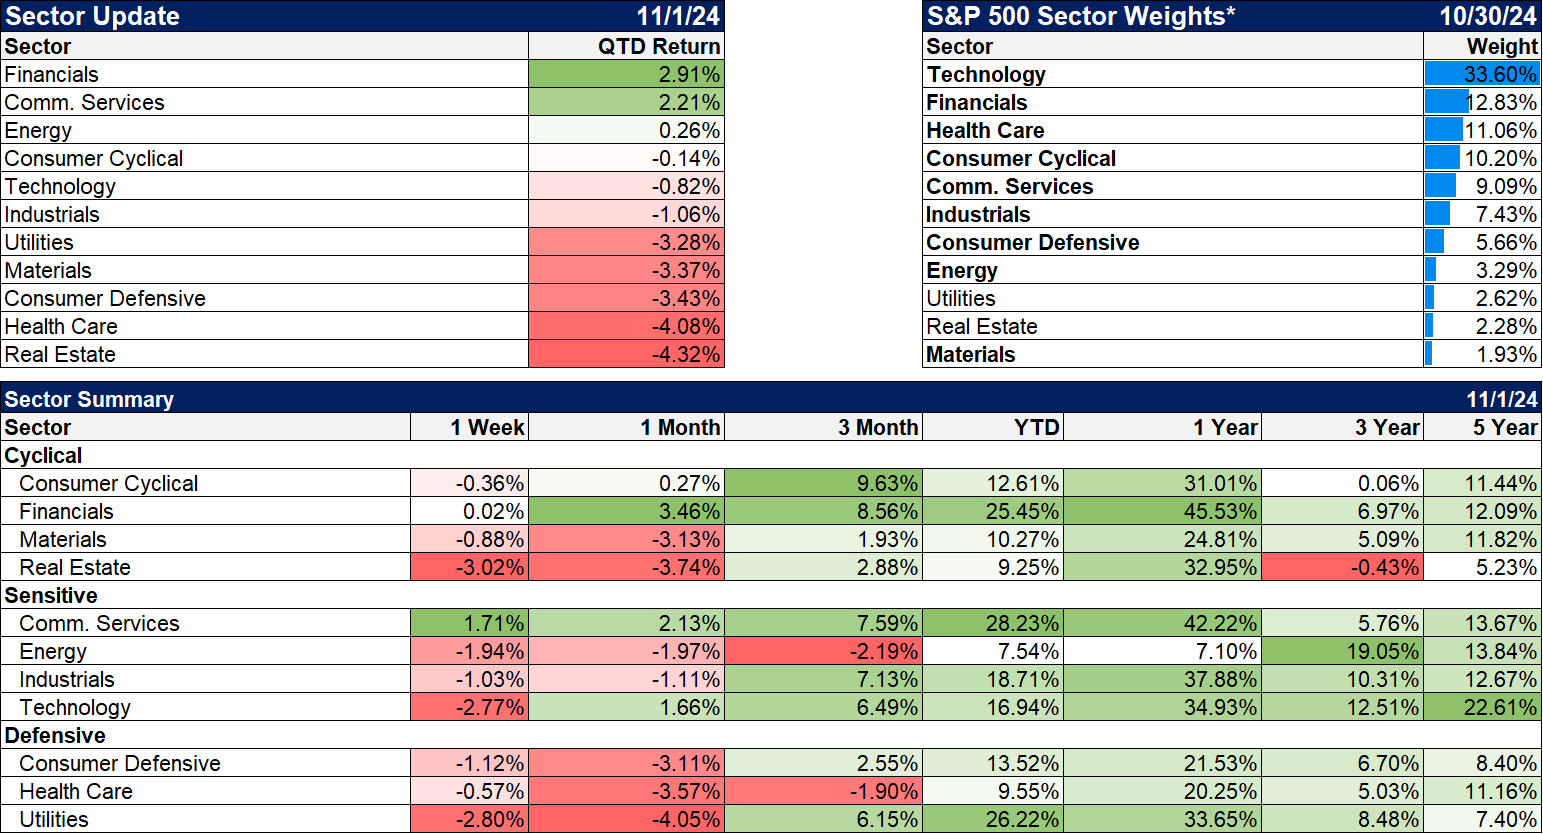
Growth has outperformed so far in the quarter but last week value had the upper hand. Earnings for the big tech stocks have been good but expectations were already high and so there was some selling on the news. Value continues to outperform over the last three years as shown below but that lead actually extends back a little over 4 years. Over that time frame, S&P 500 value has returned 91.1% while the growth index rose 75.8%. Even more surprising is that the S&P 400 (midcap) and 600 (small cap) value indexes have also outperformed the S&P 500 growth index over the last four years, up 90.7% and 77.6% respectively. The value train has left the station.
(Click on image to enlarge)
Sectors
REITs have been the worst performers so far this quarter, driven lower by rising interest rates. If rates stabilize here – and I don’t see any fundamental reason that shouldn’t be the case – then REIT performance will be dependent on the performance of the underlying assets. So far, what I’ve seen from the individual REITs we own is encouraging. There continues to be a focus on the poor performance of office assets but that sector only gets a 4% weighting in the MSCI REIT index and less than that in the DJ REIT index. The largest weightings are in Retail and Healthcare, two segments that continue to perform very well.
(Click on image to enlarge)
Economy: Market Indicators
It isn’t just the 10-year rate that has risen over the last month. The 2-year yield is also up as expectations for more rates cuts have been dialed back. On the other hand, all rates are down over the last year as NGDP growth has slowed from 6.5% a year ago to 4.9% now. Most of that drop has been due to falling inflation expectations.
Credit spreads remain very tight, basically at the lows of this cycle (and lower than the low of the last cycle). Moving down the credit quality scale doesn’t get you much in the way of extra yield.
(Click on image to enlarge)

Economy: Economic Data
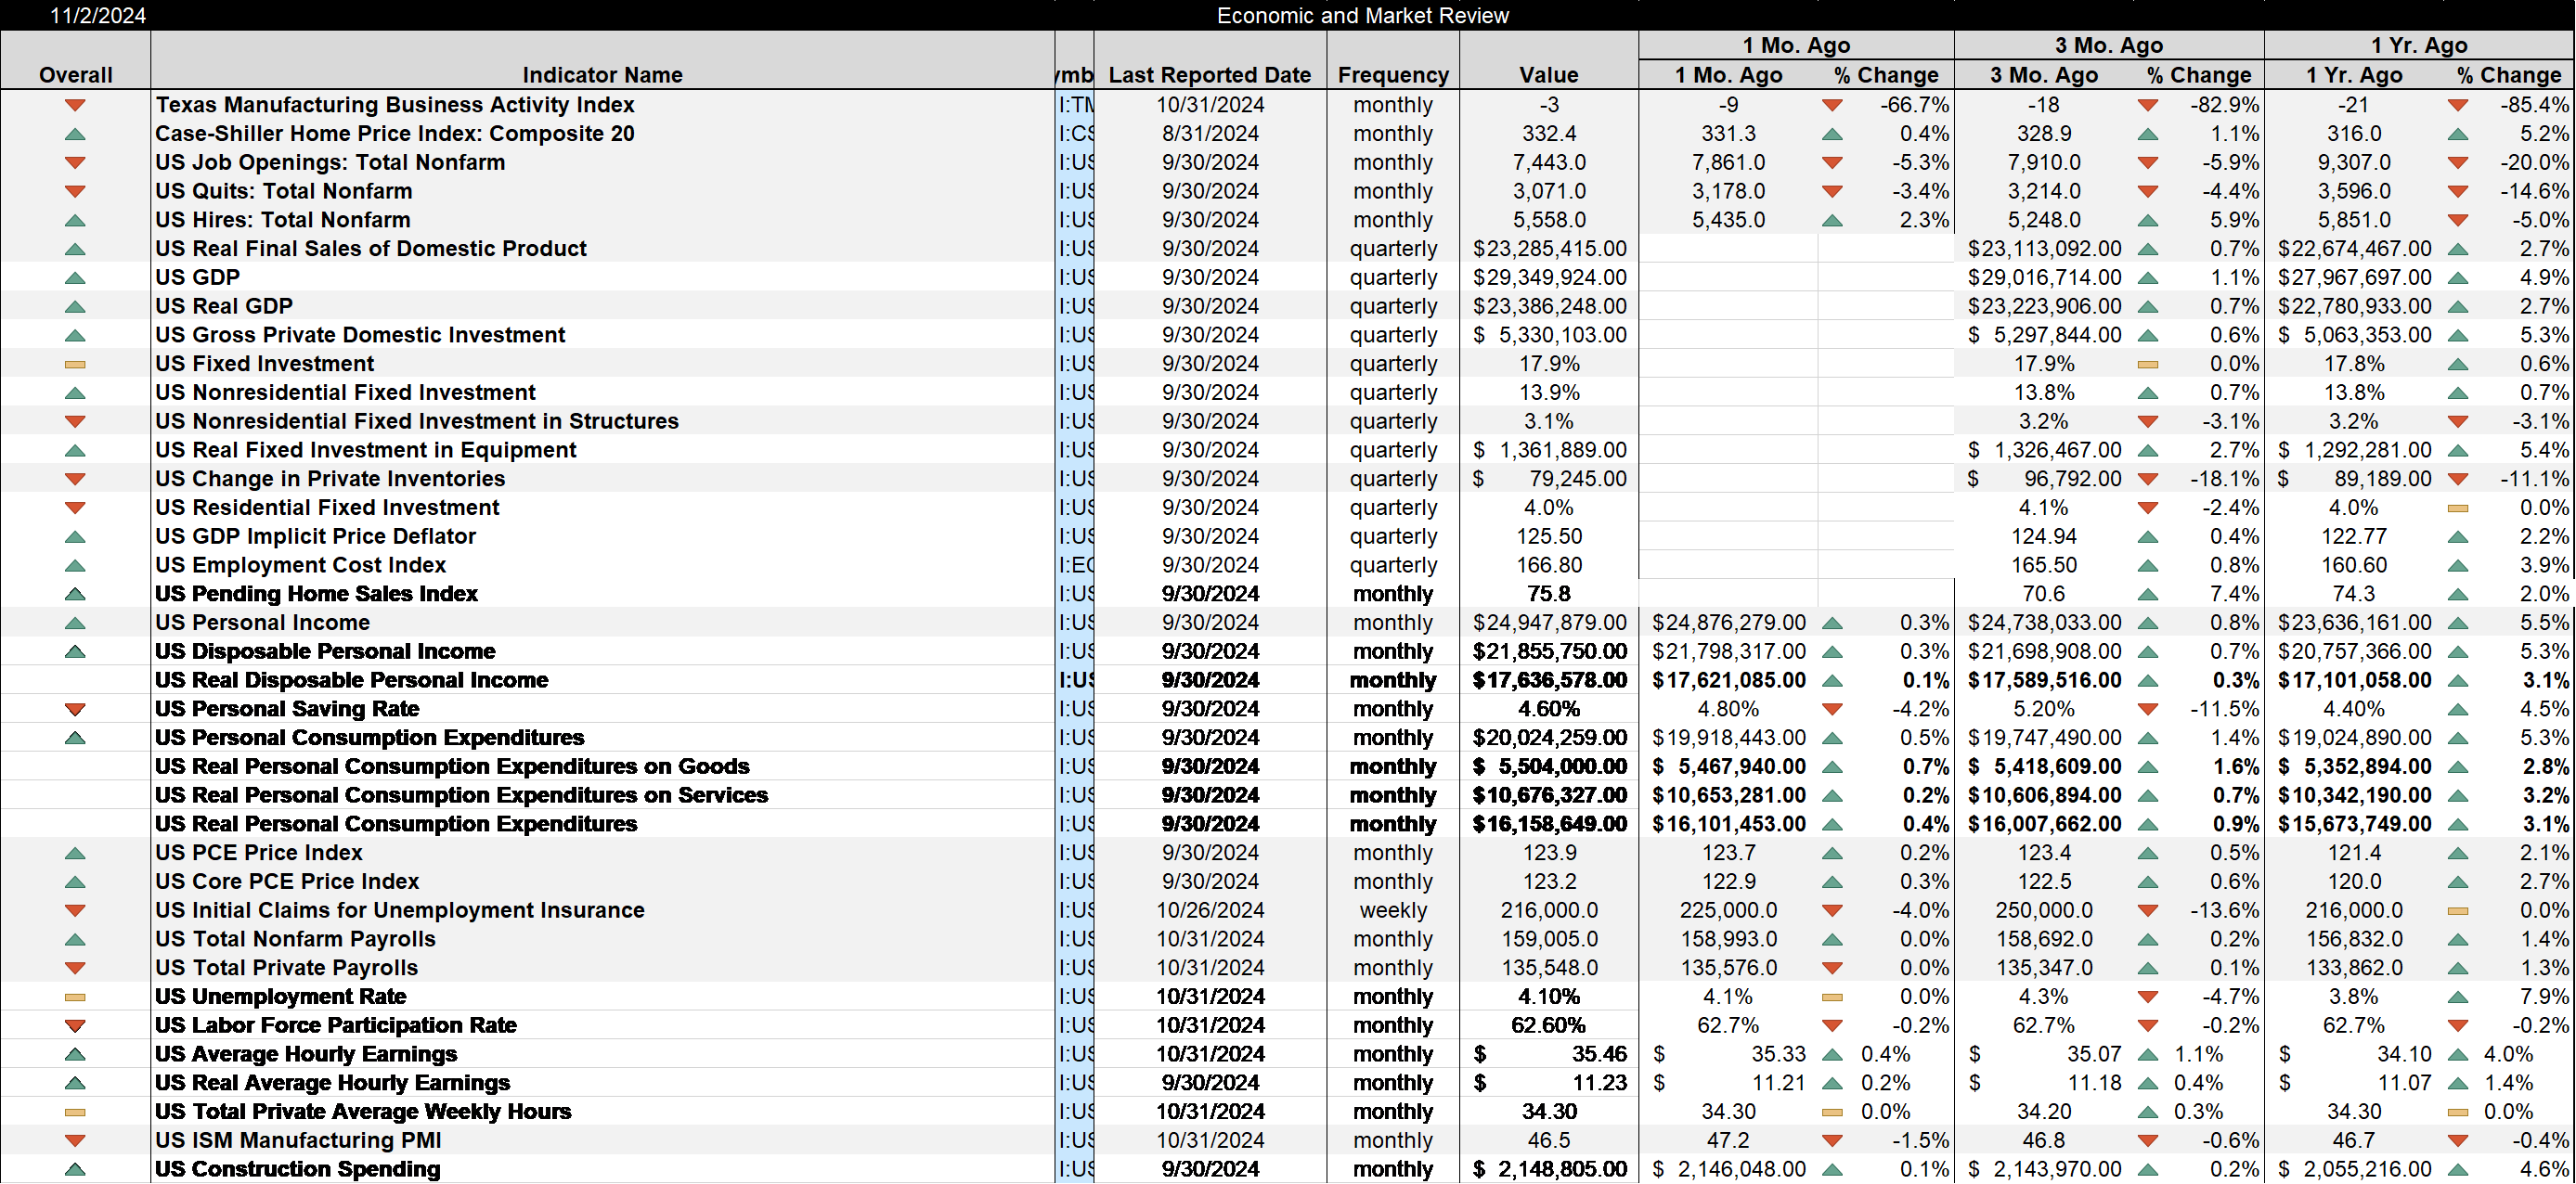
The economic data released last week was a bit mixed but overall shows a health economy. Not a lot has changed over the last six months. Real estate and manufacturing continue to struggle – both a victim of higher interest rates – as they have over the last two years. Time eventually heals all wounds and absent a drop in rates that’s what it will take to get those two back on track.
Job openings fell last month and are now down nearly 15% over the last year. It is getting harder to argue that the labor market is too tight. Quits and hires are also down over the last year by double digits.
Q3 GDP offered no surprises, coming in at a 2.8% annual rate, exactly as predicted by the Atlanta Fed’s GDPNow model. The growth was led almost entirely by consumption; investment was only 0.07% of the total. Investment was impacted by falling construction in both residential and non-residential. Investment in equipment added 0.56% to total GDP, led by information processing equipment and transportation equipment. Inventories and trade both subtracted from GDP with the former shaving 0.17 off the total while the latter pulled the total down by 0.56. On trade, imports subtracted 1.49 from total GDP but that doesn’t mean imports are bad. The reason imports subtract from GDP is because the consumption and investment totals include imports and since we’re trying to figure out domestic output, those have to be subtracted from the total. No, tariffs won’t “fix” this.
The personal income and spending report showed continued strength with income up 0.3% and spending up 0.5%. Over the last year, real disposable personal income (adjusted for taxes and inflation) is up 3.1%, well above the 2.5% annual average since 2000 and in line with the average of the 1990s (3.0%). Personal consumption has also been solid, up the same 3.1% on a real basis.
The payrolls report was disappointing but not surprising. The economy added just 12,000 jobs but the hurricanes were a big factor. We’ve seen this effect before and it will fade pretty quickly as rebuilding starts. The unemployment rate stayed steady at 4.1%.
(Click on image to enlarge)
More By This Author:
Weekly Market Pulse: Rose Colored Glasses?
Weekly Market Pulse: Stability Is Good
Weekly Market Pulse: Questions
Disclosure: This material has been distributed for informational purposes only. It is the opinion of the author and should not be considered as investment advice or a recommendation of any ...
more


