
Following futures positions of non-commercials are as of June 11, 2024.
10-year note: Currently net short 307.7k, down 147.1k.
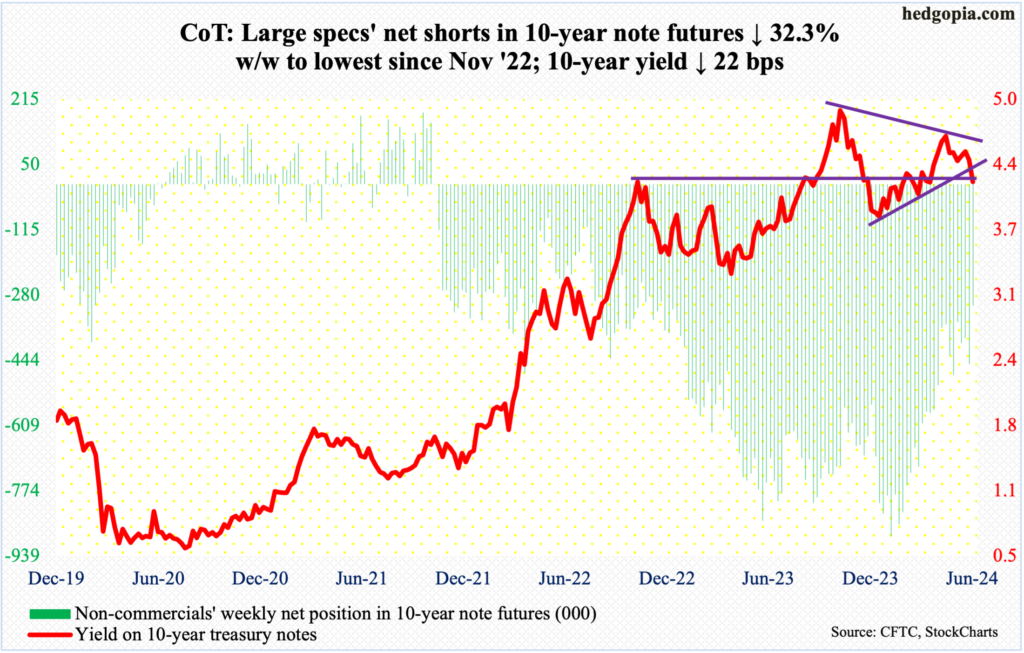
The 10-year treasury yield peaked last October at five percent (4.997 percent, to be precise), subsequently bottoming at 3.79 percent in December. From the October high, several lower highs were made, even as there were higher lows from December. This week, the lower support gave way, ending down 22 basis points to 4.21 percent. Also gone is horizontal support at 4.3s.
In due course, the December low could be in play. Right here and now, bond bears (on price) are likely to be willing to defend horizontal support at 4.2s. Speaking of which, non-commercials massively cut their net shorts in 10-year note futures this week, ending Tuesday at 307,692 contracts – the lowest since November 2022. Mid-January (this year), they were net short a record 889,385.
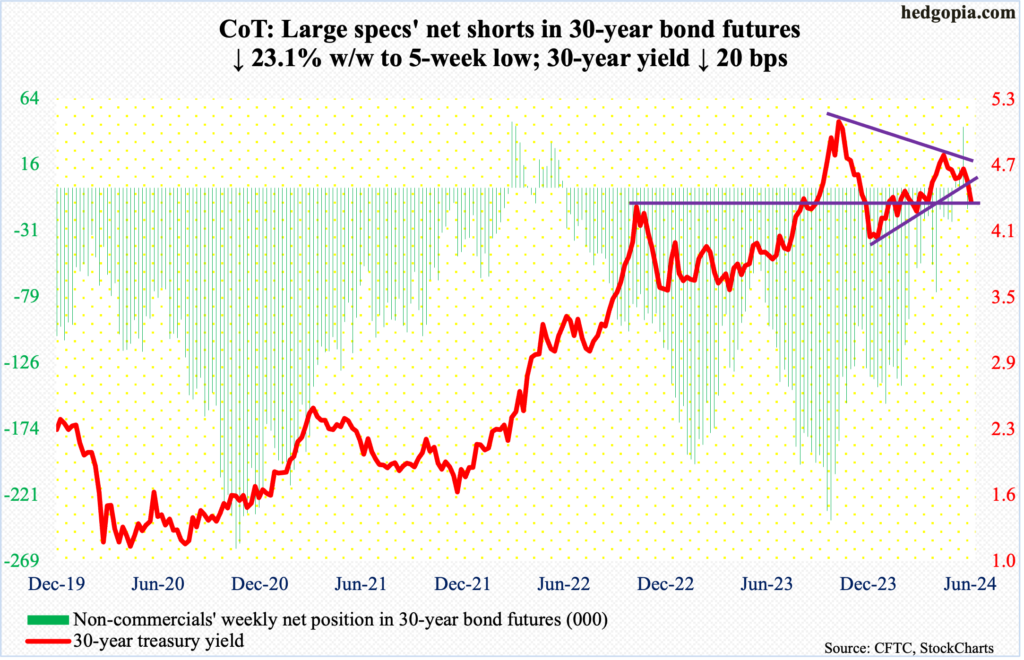
30-year bond: Currently net short 11.9k, down 3.6k.
Major US economic releases for next week are as follows. Markets are closed Wednesday for observance of Juneteenth Day.
Retail sales (May) and industrial production (May) are due out Tuesday.
Retail sales in April edged up 0.02 percent month-over-month to a seasonally adjusted annual rate of $705.2 billion – a new high.
Capacity utilization edged lower 0.1 percent m/m to 78.4 percent – a three-month low. January’s 77.9 percent was the lowest since September 2021.
The NAHB housing market index (June) will be reported on Wednesday. Homebuilder optimism declined six points m/m in May to 45 – a four-month low.
Thursday brings housing starts (May). They jumped 5.7 percent m/m in April to 1.36 million units (SAAR). March’s 1.29 million set a 44-month low.
Friday brings existing home sales (May). April sales were down 1.9 percent m/m to 4.14 million units – a three-month low.
WTI crude oil: Currently net long 251.5k, up 26.9k.
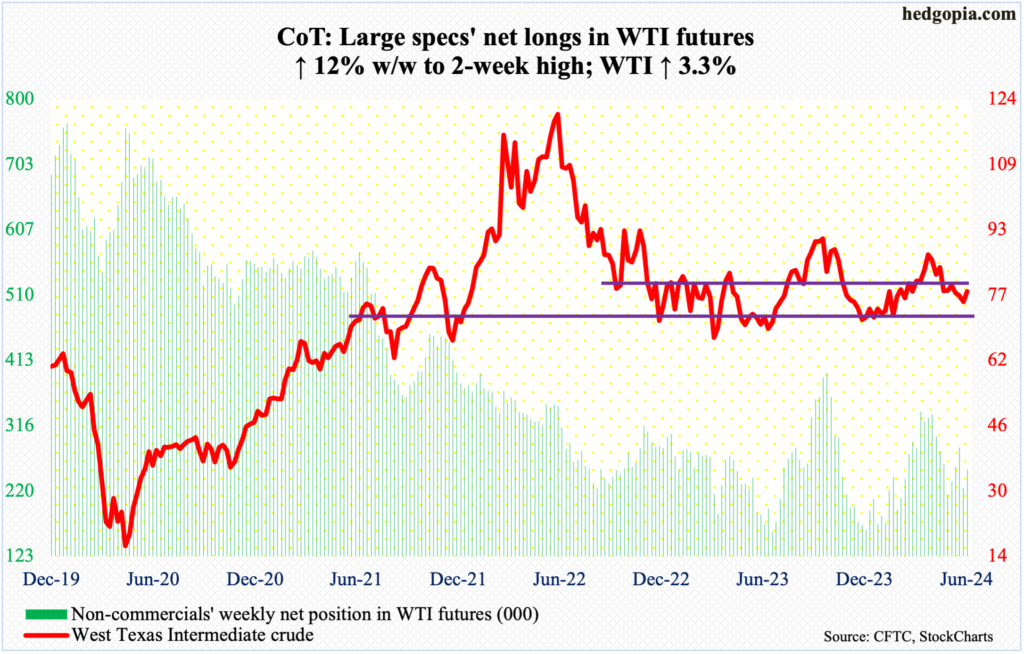
On the 4th (this month), West Texas Intermediate crude tagged $72.48 intraday before reversing higher. Earlier on April 12th, it retreated after ticking $87.67. That low just about tested the low end of a range between $71-$72 and $81-$82 that persisted for 19 months before the upper end gave way 11 weeks ago and was subsequently lost early May.
This Wednesday, WTI touched $79.32, and sellers promptly showed up, ending the week up 3.3 percent to $78.05. Rally odds are stronger on the weekly, with the daily likely to continue to face resistance just south of $80, or the afore-mentioned $81-$82. The 50- and 200-day moving averages respectively lie at $80.07 and $79.63.
In the meantime, after 13 consecutive weeks of 13.1 million barrels per day US crude production increased 100,000 b/d to 13.2 mb/d; 16 weeks ago, output was at a record 13.3 mb/d. Crude imports grew as well, up 1.2 mb/d to 8.3 mb/d. As did stocks of crude, gasoline, and distillates, which respectively rose 3.7 million barrels, 2.6 million barrels and 881,000 barrels to 459.7 million barrels, 233.5 million barrels and 123.4 million barrels. Refinery utilization decreased four-tenths of a percentage point to 95 percent.
E-mini S&P 500: Currently net short 111.4k, up 46.4k.
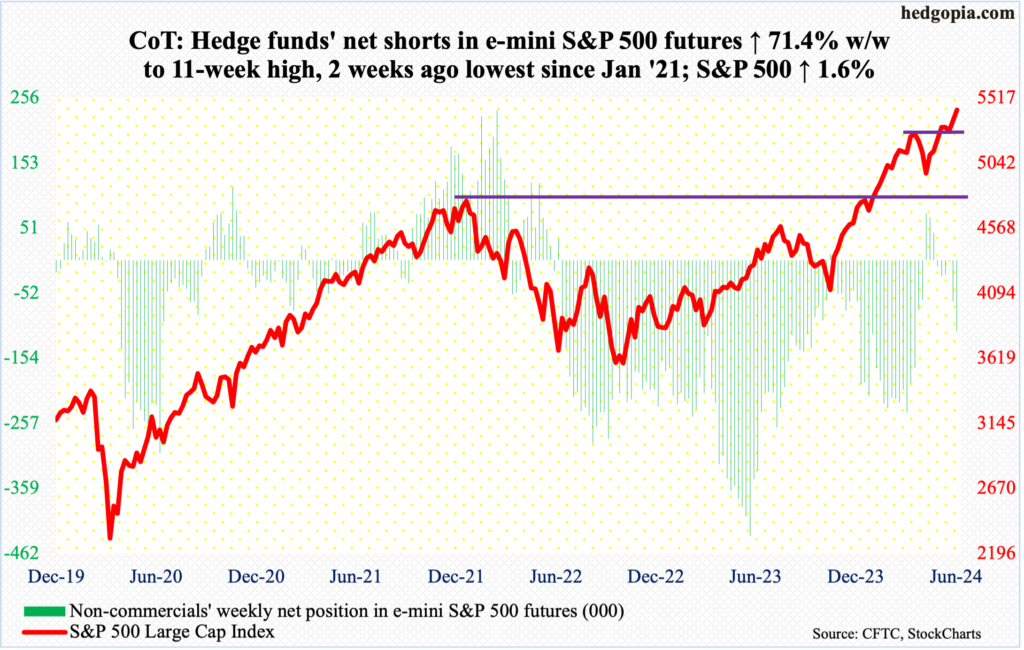
Several times in the last several weeks or months, equity bears fell short of capitalizing on potentially bearish technical setups. After four weeks of strength post-last October’s low, a long-legged doji showed up on the weekly four weeks ago, followed by a weekly hanging man. The latter candle in particular was not confirmed as bulls put up a strong show in the subsequent two weeks, with this week up 1.6 percent and last week 1.3 percent.
Bears yet again have an opportunity. On Wednesday, the S&P 500 posted a new intraday high of 5447 but only to close at 5421, resulting in a daily shooting star. This was followed by back-to-back buying pressure that showed up just north of 5400, forming a hanging man on both Thursday and Friday, ending the week at 5432.
If weakness develops this week, this would have come after seven out of eight weeks of unrelenting rally. Last October, the large cap index bottomed at 4104.
Euro: Currently net long 43.6k, down 24.2k.
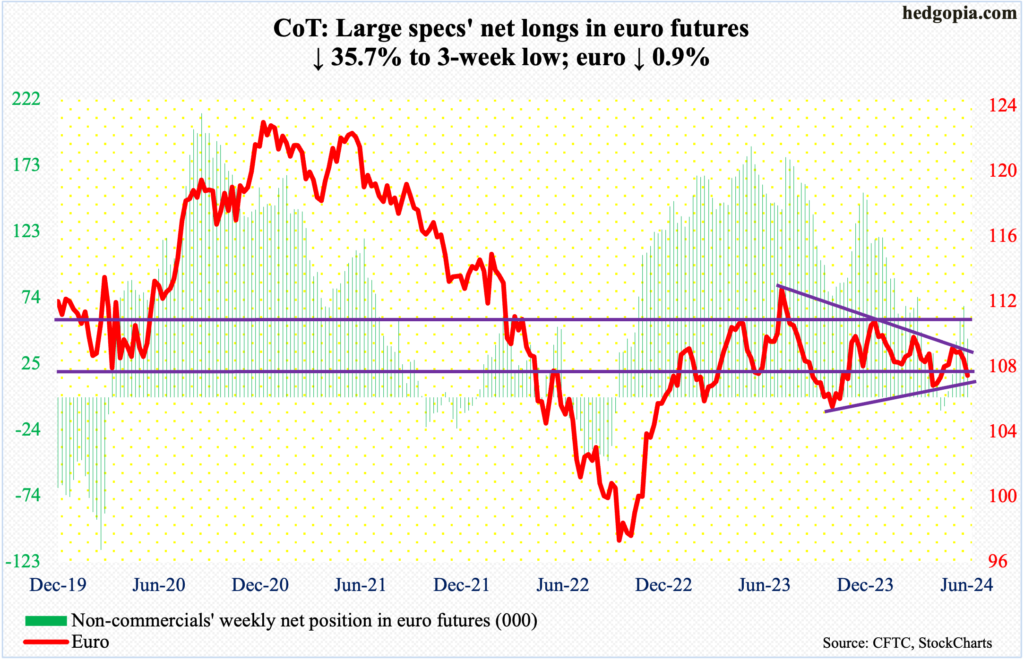
The euro ($1.0706) finds itself at a crucial juncture.
Since last July when the currency retreated after touching $1.1270, it has made lower highs. Concurrently, it has made higher lows since last October when it bottomed at $1.0448. The resulting symmetrical triangle – or a wedge – has been narrowing and remains intact.
This week’s high ($1.0852 on Wednesday) and low ($1.0668 on Friday) kissed both the upper and lower lines of the pattern in question. A break either way has the potential to dictate momentum – at least near term.
Gold: Currently net long 233.9k, down 3.4k.
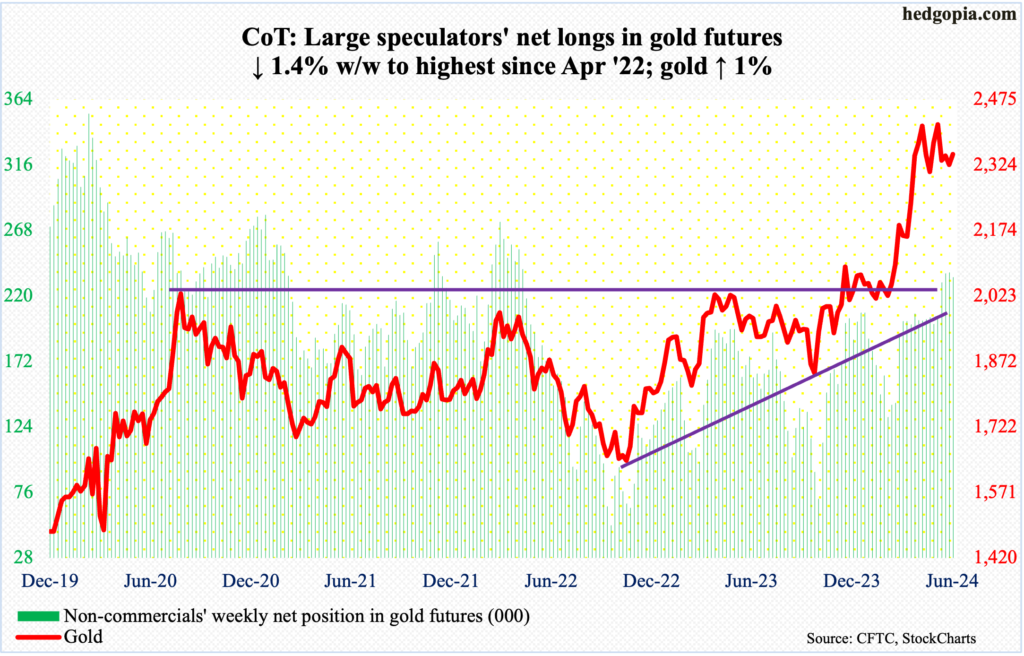
Last Friday, after hugging the average for 10 consecutive sessions, gold sliced through the 50-day. This week, it remained under the average in all five sessions, with attempts to reclaim in on Wednesday unsuccessful. That said, the metal ($2,349/ounce) is not that far away from the average at $2,358, and there is room to rally on the daily. For this, defense of $2,300 is a must for gold bugs. Else, the weekly can take over.
Gold has come a long way since last October when it ticked $1,824 (was $1,996 this February). It came under pressure after it set a new high of $2,454 on May 20th.
Nasdaq (mini): Currently net short 8k, up 10k.
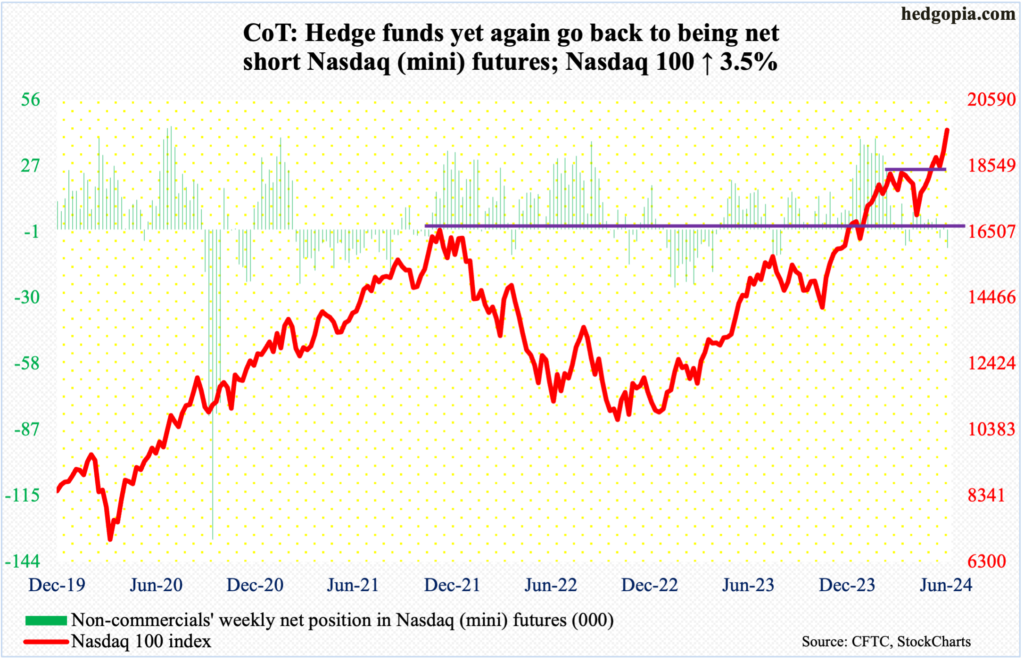
On the back of Apple (AAPL)’s strong performance, the Nasdaq 100 had yet another strong week, up 3.5 percent to 19660, for a bullish marubozu weekly candle. This was the second consecutive up week – and 7th in the last eight. From last October’s low through Friday’s high (19665), the tech-heavy index surged 39.9 percent – and 88.3 percent from the October 2022 low of 10441!
History has shown us time and again that bubbles only get bigger until some catalysts act as a pricking pin. For now, tech bulls seem to be sitting pretty, even though some of the moves defy logic. AAPL’s 7.9-percent jump – was up 11.8 percent at Wednesday’s high – breaking out of $197 resistance was one such event this week. It is a $3-trillion-plus company and is a stock followed by nearly every major brokerage house. Not a biotech company, for instance, that suddenly achieves a major milestone and the stock reacts, AAPL’s business is well known. A double-digit move in a single week in a stock like this is a sign of the ebullient times.
Russell 2000 mini-index: Currently net short 38.3k, up 3.9k.
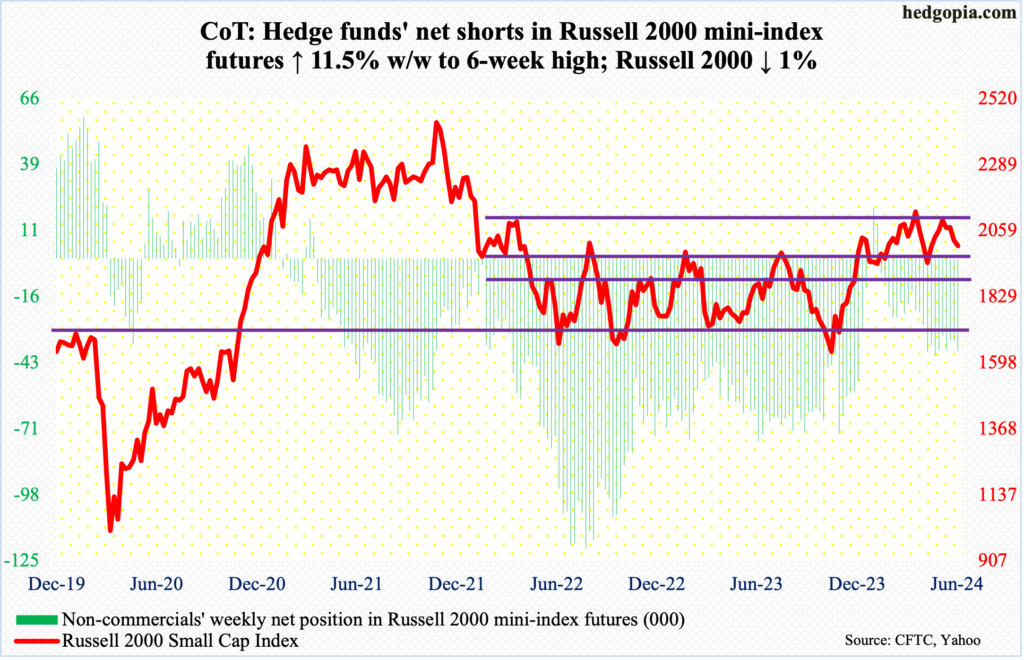
For the second consecutive week, small-caps diverged with red-hot large-caps. The Russell 2000 gave back one percent this week, coming on the heels of last week’s 2.1-percent downdraft.
It was a wild week, with a high of 2089 (Wednesday) and a low of 1999 (Friday), closing at 2006 – near the weekly low and at/near dual support.
The small cap index has been trading within a descending channel since May 15th when it tagged 2112; Friday’s low tested that support. The index has also traded above 2000 since early May.
Repeated failure at 2100 since early March raises the odds 2000 will be compromised sooner than later. If this scenario comes to pass, then breakout retest at 1900 is just a matter of time. The Russell 2000 broke out of that level last December. Before that, the index went back and forth between 1700 and 1900 going back to January 2022.
US Dollar Index: Currently net long 5k, up 126.
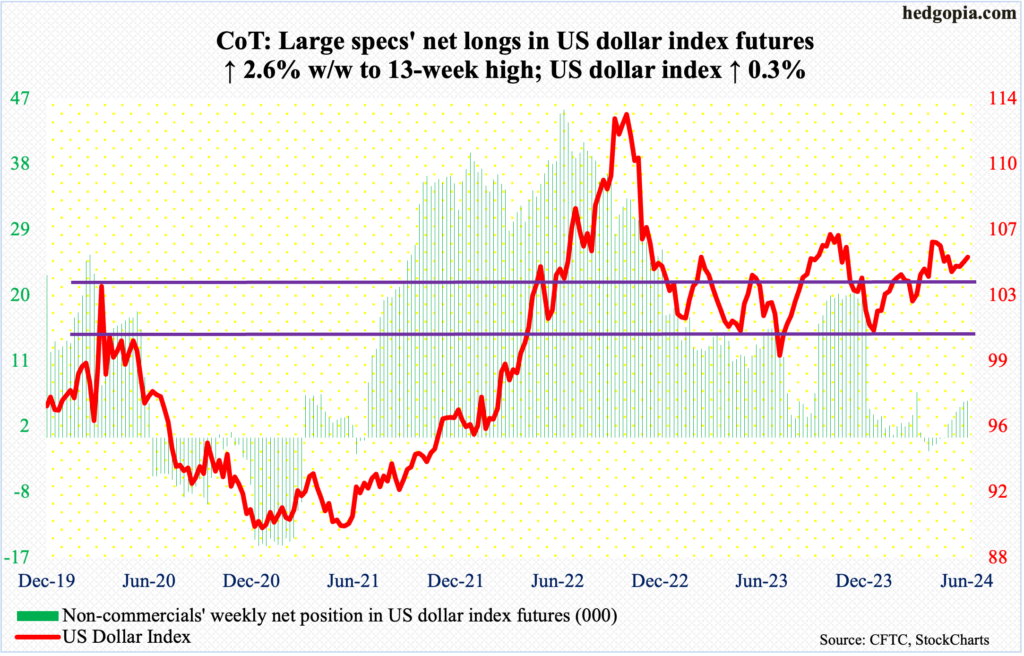
Last week, a rising trendline from last December when the US dollar index bottomed at 100.32 was breached intraweek but saved by the end. This occurred again this week as Wednesday’s low of 104.23 would have breached that support but only for bids to show up on time to push the index up 0.3 percent to 105.17.
In the end, dollar bulls managed to save both the trendline in question and horizontal support at 103-104, which goes back to December 2016.
VIX: Currently net short 48.4k, up 7.2k.
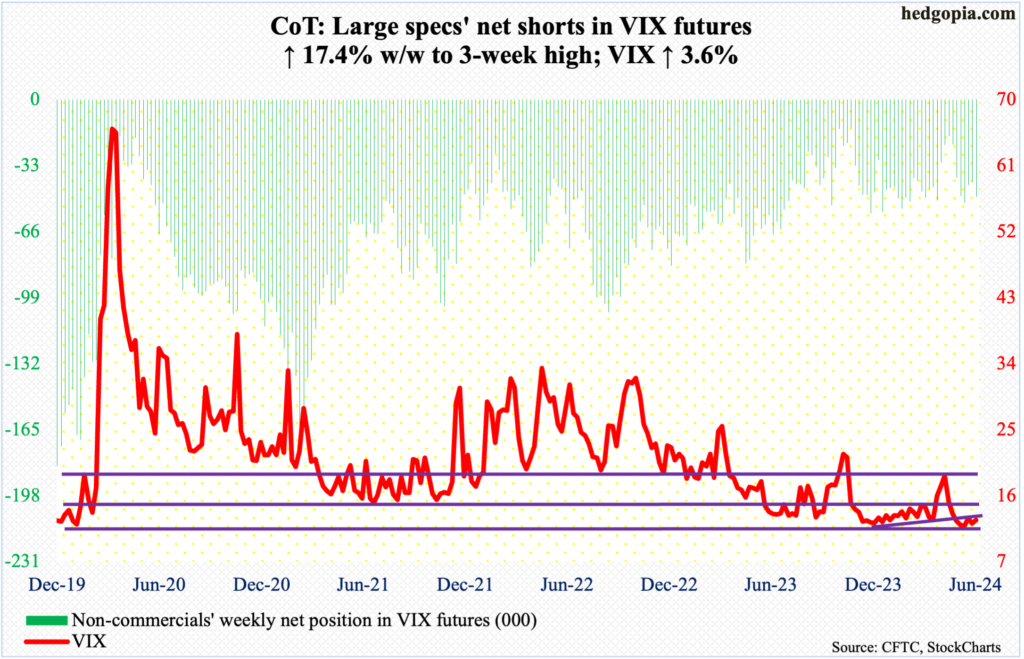
VIX dropped as low as 11.88 intraday Thursday, although it did not undercut the May 23rd low of 11.52. When it was all said and done, the volatility index rallied 0.44 points to 12.66 for the week. This does not happen often – going hand to hand with the S&P 500, that is. The two tend to go in opposite directions.
Going back six years, volatility bulls have repeatedly defended 12, and this seems to be happening again. This is taking place at a time when traders are aggressively snapping up calls; the CBOE equity-only put-to-call ratio produced readings of 0.50s in six of the last seven sessions.
Thanks for reading!
More By This Author:
No Love For Small-Caps, Which Refuse To Respond To Robust Payrolls
CoT: Peek Into Future Through Futures, Hedge Funds Positions
Back-To-Back Hanging Man Forms On S&P 500, But Pattern Needs Confirmation


Comments
Log in or sign up to join the conversation.