

Quote of the day: “Use your eyes to see the possibilities, not the problems.”— Clintonian Maximus
Commentary
The old adage of “no news being good news” doesn’t always apply. There were no notable bullish or bearish events, e.g., earnings or economic data, to report in today’s trading session. Fed Chairman Powell will provide stock market investors with plenty to consider when he speaks this Friday at the annual Jackson Hole Economic Policy Symposium. Aside from that, Tuesday will reveal the latest update for Manufacturing PMI numbers. Given recent trends and expectations, a contraction instead of an expansion would not be a surprise.
(As a sidebar note, a weaker economy accompanied by continual interest rate hikes is a recipe for stagflation and becomes a difficult quagmire for the market and Federal Reserve to navigate. Fortunately or unfortunately, most of the inflation the U.S. and other global regions are experiencing is not directly attributable to domestic policies but is rooted in geopolitical issues, e.g., supply-chain disruptions from the Covid pandemic and the Russia vs Ukraine war. A reversal in either of these at some point would have a positive impact on relieving inflation.)
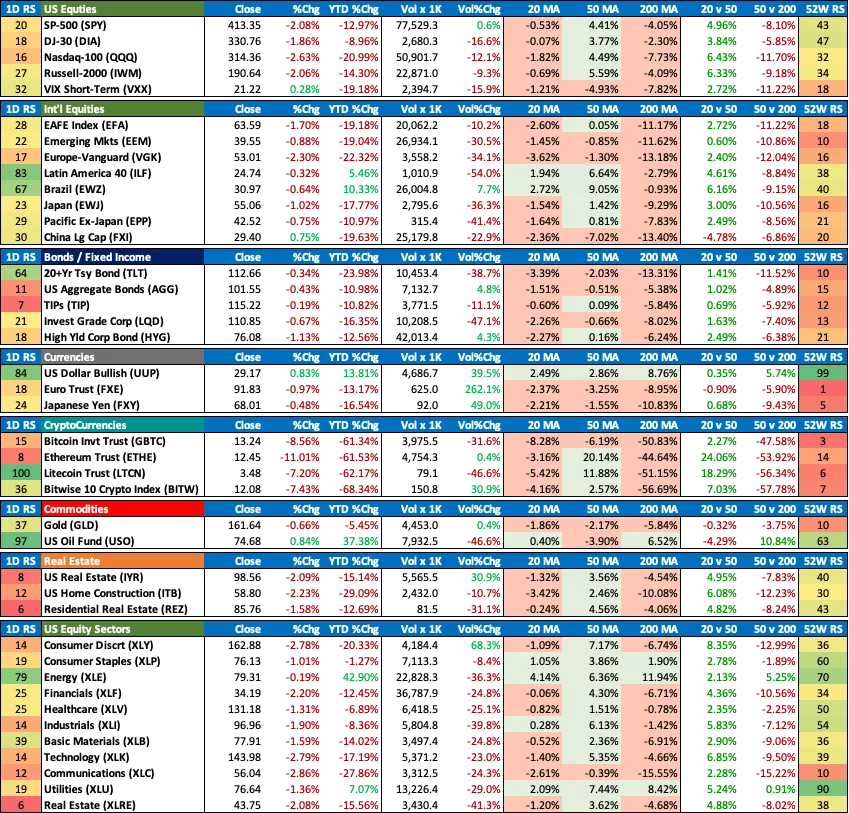
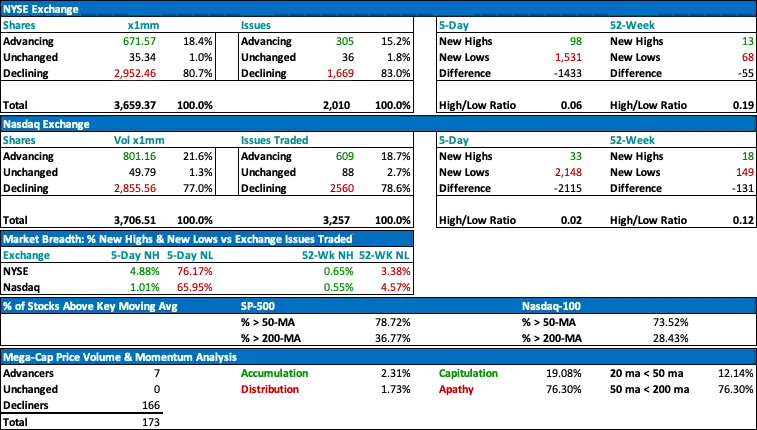
Similar to Friday, there are no safe places to hide and protect capital, with the exception of the US Dollar. Market breadth for 5-day highs vs 5-day lows and 52-week highs vs 52-week lows is overwhelmingly negative. Even more disturbing has been the rapid deterioration of support for the percentage of stocks trading above their 200-day moving average: SP-500 (36.77%) and Nasdaq-100 (28.43%). While on the topic of bad news, we might as well disclose all. The latest analysis of the TMI 100-Club, which represents stocks belonging to the SP-100 and Nasdaq-100 indexes and comprises 173 members, indicates more than 76% are in death-cross mode (50-day moving average below 200-day moving average). Yikes… Pretty scary and it’s not even October yet.
Bullish Events |
|
|
|
Neutral Events |
|
|
|
Bearish Events |
|
Technically Speaking
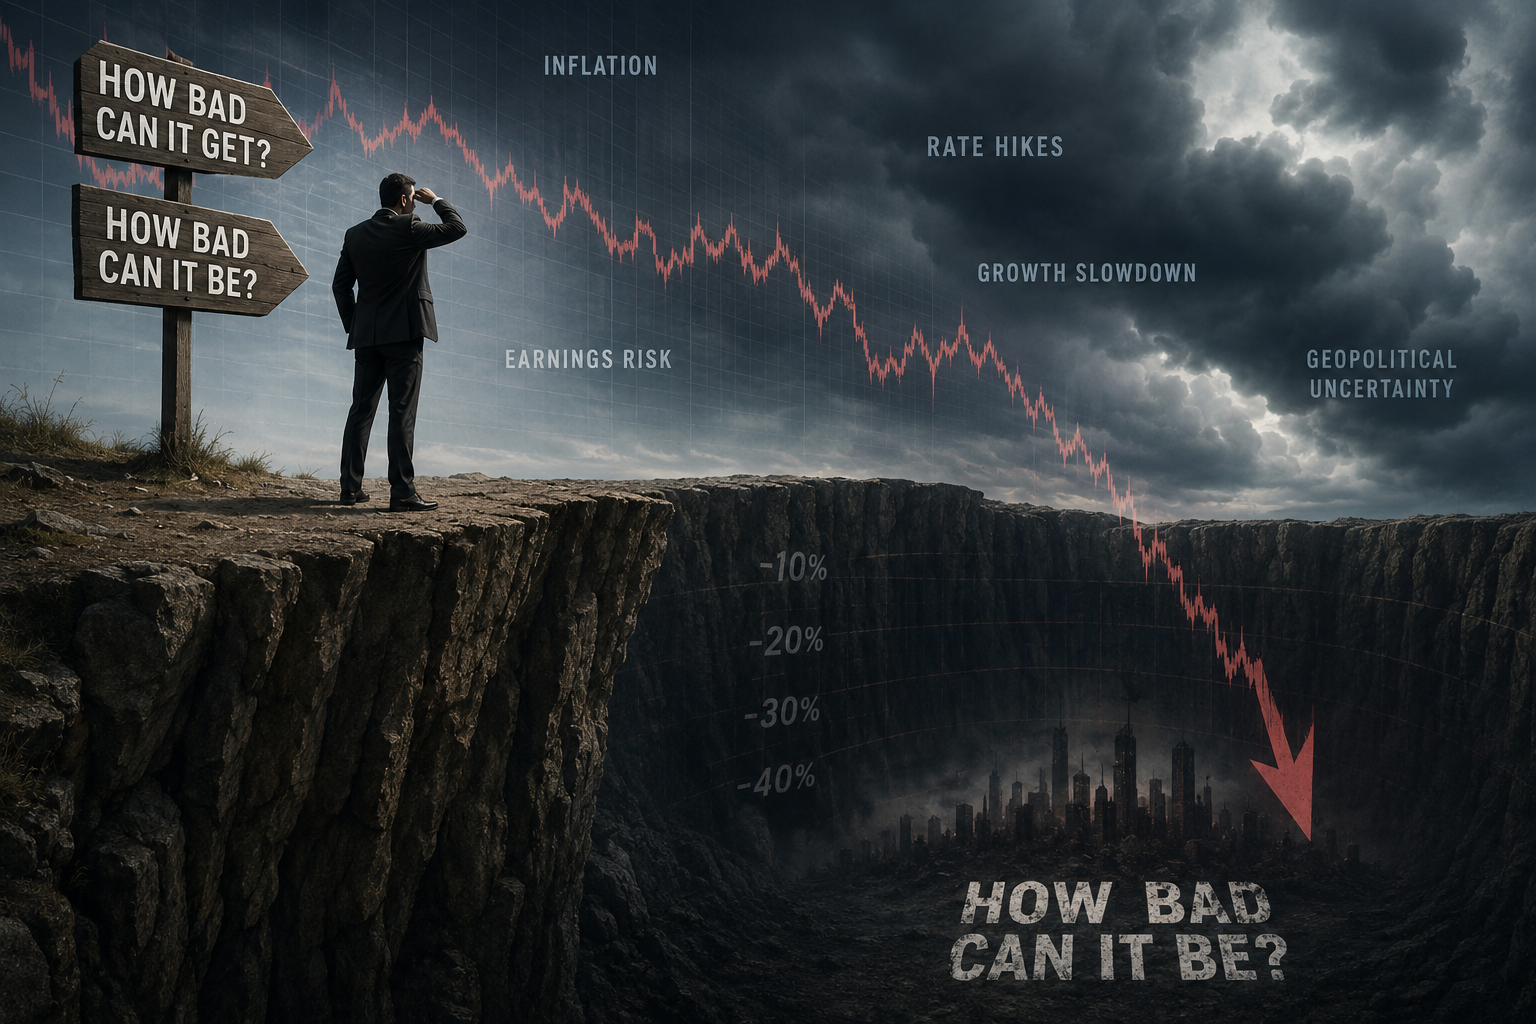
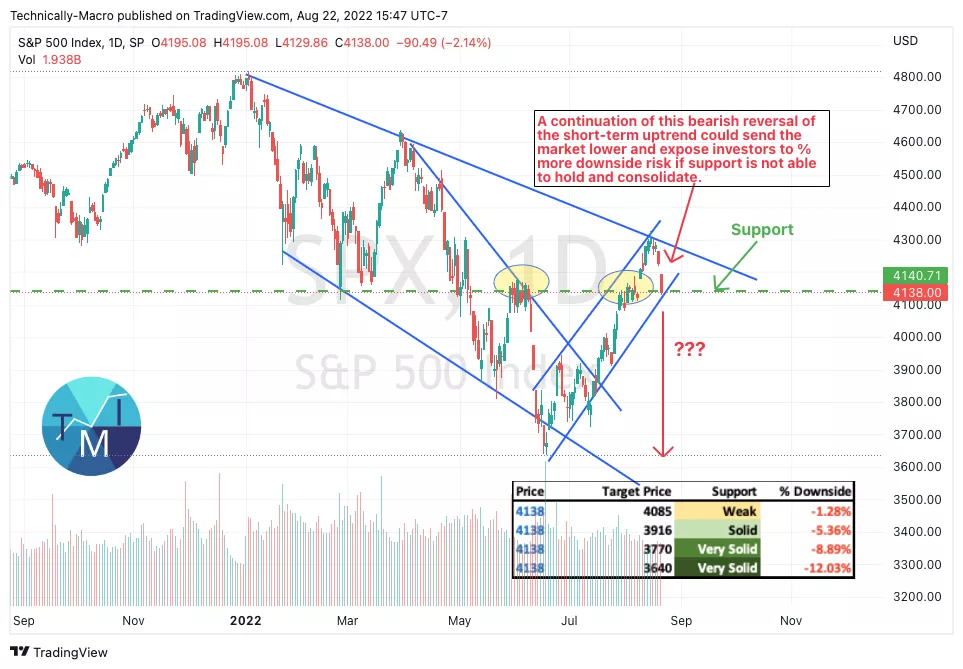
How bad can it be or how bad can it get? The S&P 500 is currently testing support at the lower range of its short-term bullish channel and two recently previous support levels. The probability of it breaking support is fairly high as its intermediate trend is showing a bearish channel pattern in which it has zigged and zagged upward and downward since the beginning of Jan-2022. Based upon my analysis, the daily chart indicates fairly solid support @ 3916 or @ -5.36% of downside risk. The next two lower support targets show downside risk ranging from -9% to -12%. If one is not willing to tolerate this level of risk, then hedging strategies may be considered.
(Click on image to enlarge)
Capital Markets
Stocks |
|
Bonds |
|
Currencies |
|
Cryptocurrencies |
|
Commodities |
|
Real Estate |
|
Daily ETF Performance Monitor
(Click on image to enlarge)
Market Diary
(Click on image to enlarge)
Earnings
Sector | Positive Surprise | Meeting Expectations | Negative Surprise |
Technology | ZM*; PANW* |
|
|
*Earnings reported After-market hours
Market SWOT Analysis
Strengths (happening now) | Weaknesses (happening now) |
|
|
Opportunities (could happen) | Threats (could happen) |
|
|
More By This Author:
TMI Market Notes: Overbought Market Consolidating But Vulnerable To Correction
TMI Market Notes: Overbought Stock Market Confirmed By Buyer Apathy
TMI Market Notes: Market Gets High on the Latest CPI


Comments
Log in or sign up to join the conversation.