Wednesday, August 17, 2022 7:44 AM EST
Quote of the day: “Is Okay-ness really a life?”
— Tammie Ortlieb, author of If The Crown Fits

Commentary
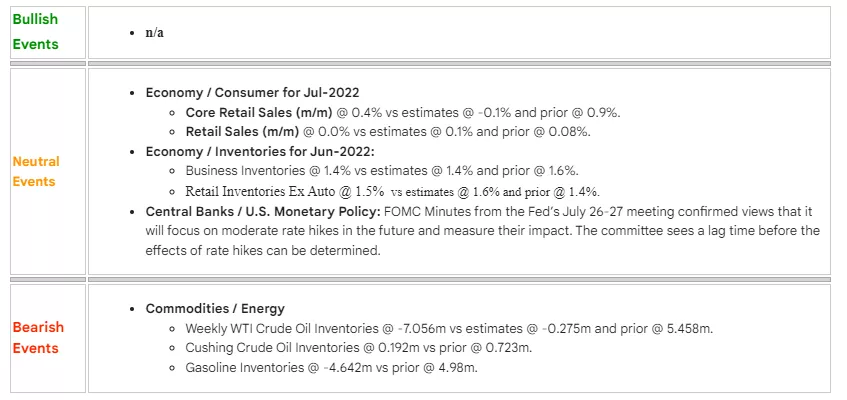
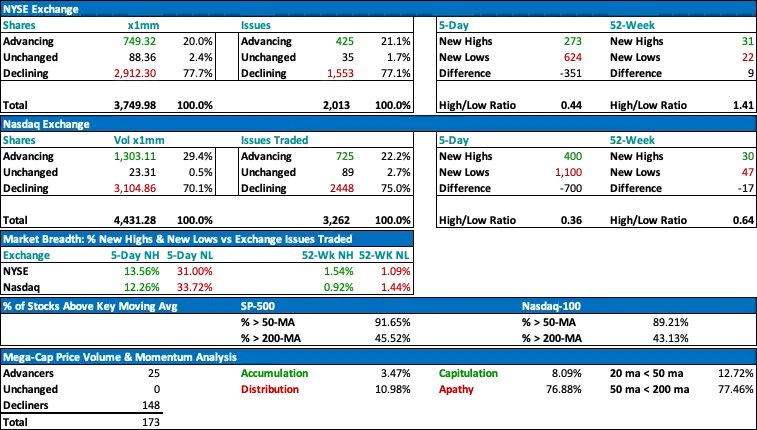
As predicted or anticipated yesterday, equity markets are beginning to weaken in the midst of an overbought market condition. Impacting today’s trading session was the release of the minutes from last month’s FOMC meeting. While a review of its highlights revealed future monetary policy strategies to be in alignment with market expectations, the Fed’s acknowledgment of a lag time before increases to the fed funds rate can begin to take noticeable effect has some worried. Economic data was neutral at best with Retail Sales and Inventory reports and void of any signs of growth. The American consumer is muddling along and until gasoline and oil prices recede, he or she will continue to do so. The absence of any bullish news events makes it difficult to sustain the rationale for higher stock prices. The result is buyer apathy (# of stocks down in price on lower volume) sets a bearish tone. All major classes finished in the red with the exception given to energy commodities, i.e. Crude Oil and Gasoline prices.
(Click on image to enlarge)
Technically Speaking
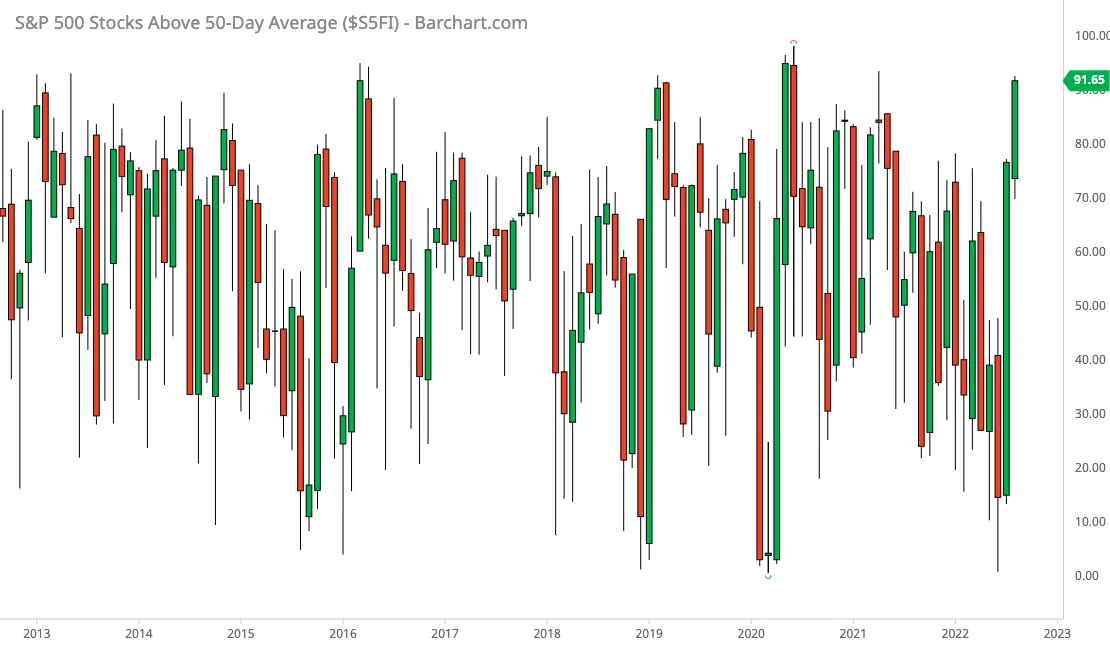
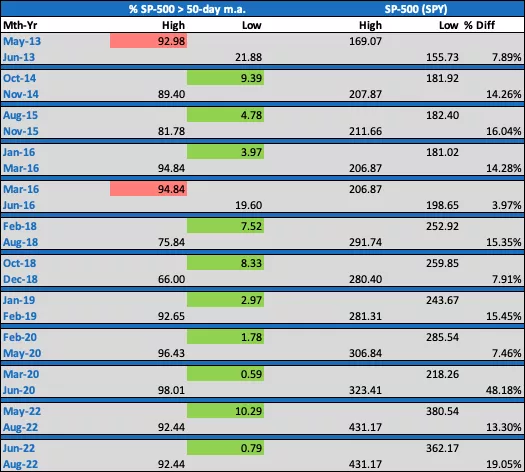
Today’s technical analysis focuses on a variant of the widely followed 50-day moving average. Below is a monthly chart showing the trend for the percentage of SP-500 stocks trading above their 50-day moving average for approximately the last 10 years. Supplementing it is a proprietary tabular analysis summarizing the differentials of its highs and lows. The purpose of providing this is not to recommend any specific trading, but instead to highlight the probability and magnitude of market direction movements whenever this indicator reaches extreme levels, e.g. above 90 or below 10. Because we still remain in a secular bull market or super cycle that has yet to end, the downward moves from peaks tend to be less severe. After all, bull markets typically produce higher highs and lows, so it does make sense.
The % of SP-500 stocks trading above their 50-day moving average is once again near extreme levels with a reading @ 91.65. Given the strong advance in less than 2 months, a correction or pullback of at least 5-7% would be normal at this juncture. I’ll refrain from any further comments and allow you to make your own inferences with the data I have shared. At some future point, I may dive deeper into this analysis as this is one of my favorite indicators to use in conjunction with price trends.
(Click on image to enlarge)
Capital Markets
|
Stocks
|
- Performance: SP-500 @ 4274.04 (-0.72%); Nasdaq-100 @ 13470.86 (-1.21%); Russell-2000 @ 1937.31 (-1.64%); DJ-30 @ 33980.33 (-0.50%); DJ-Transports @ 14915.49 (-1.94%); DJ-Utilities @ 1053.87 (0.00%); VIX @ 19.90 (+1.07%)
- Leading Sectors: Energy (XLE); Consumer Staples (XLP); Utilities (XLU)
- Lagging Sectors: Communications (XLC); Consumer Discretionary (XLY); Materials (XLB)
|
|
Bonds
|
- Performance: 10-Yr Treasury rates @ 2.89 (+2.48%); 10-Yr T-Note @ 118’24’5 (-0.52%)
- Comments: n/a
|
|
Currencies
|
- Performance: USD @ 106.64 (+0.15%); EURUSD @ 1.01777 (+0.07%); JPYUSD @ 0.74010 (-0.62%)
- Comments: n/a
|
|
Cryptocurrencies
|
- Performance: Bitcoin @ 23404.00 (-2.39%); Ethereum @ 1850.29 (-1.78%); Binance @ 309.699 (-2.52%); Cardano @ 0.541759 (-4.28%); Ripple @ 0.381873 (+1.86%)
- Comments: n/a
|
|
Commodities
|
- Metals: Gold @ 1762.10 (-0.75%); Silver @ 19.7967 (-1.70%); Copper @ 3.5980 (-1.06%)
- Energy: WTI Crude Oil @ 88.11 (+1.83%); NatGas @ 9.244 (-0.091%); RB Gasoline @ 2.9345 (+1.17%)
- Grains: Wheat @ 784-2 (-0.73%); Corn @ 697-4 (+0.58%); Soybeans @ 1512-0 (+0.73%)
|
|
Real Estate
|
- Performance: DJ Real Estate Index @ 396.62 (-0.46%); DJ Home Construction @ 1259.11 (-1.94%)
- Comments: Weekly MBA Mortgage Applications- Composite Index @ -2.3% vs prior week @ +0.2%; Purchase Index @ -1.4% vs prior @ -0.8%; and Refinance Index @ 3.5% vs prior week @ -5.4%.
|
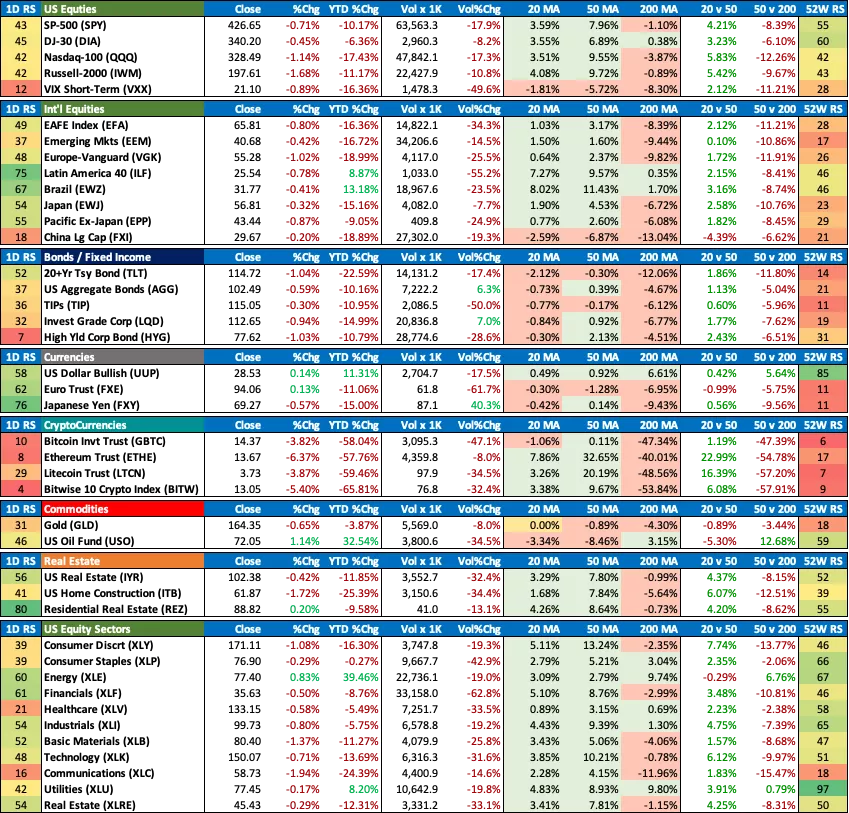
Daily ETF Performance Monitor
(Click on image to enlarge)
Market Diary
(Click on image to enlarge)
Earnings

Market SWOT Analysis
|
Strengths (happening now)
|
Weaknesses (happening now)
|
|
- Energy Production Capacity Growing: Decline in WTI Crude Oil rapidly accelerating and the mantra that higher prices correct higher prices is being realized. Even more significant is the contraction in RBOB Gasoline futures, which ultimately translates into relief at the gas pumps for American consumers.
- Strong Employment Situation: The July-2022 employment report indicated a 528k increase of new jobs vs June-2022’s already robust gain of 398k. The unemployment rate is ticked lower to 3.5% vs prior @ 3.6%. It’s a tight labor market and therefore wage inflation should be expected. However, if the Fed is able to reign in high fuel and food prices by raising rates, then this creates a situation for a strong recovery in consumer activity.
- Cryptocurrencies: Bitcoin and Ethereum are proxies of investor sentiment toward risk and appear to have found support and are initiating new uptrends. If so, this could have bullish implications for equity markets.
|
- Untamed Inflation: Consumer prices (CPI data), which are closely monitored by the Fed, have been trending above 8%+ with the potential for double-digit inflation. The June-2022 report to be released in July 2022 could trigger more aggressive rate hikes.
- Geopolitical Risk in Greater China: House Speaker Nancy Pelosi’s visit to Taiwan has clearly upset China and emboldened it to step up its military exercises and threaten invasion of the island. The risk of confrontation with the U.S. must be balanced and taken into consideration.
- Continued Disruptions in China Supply Chain: Covid infection rates in are increasing and prompting Chinese officials to once again shut down its economy, thus exacerbating supply chain bottlenecks.
|
|
Opportunities (could happen)
|
Threats (could happen)
|
- Lower Energy Prices: The Federal Reserve’s resolve to combat inflation with aggressive rate hikes will have the collateral effect of creating a stronger dollar and, if a soft landing is achieved, a mild recession will contribute to demand destruction for energy and lower prices for consumers. A decline in energy prices could reignite consumer demand and confidence, especially if the labor market remains stable.
- Cutting a deal with Iran: The U.S. and Iran are currently negotiating to end sanctions and bring Iranian oil back online if certain parameters for nuclear testing and development can be accomplished. If so, this would immediately alleviate any supply imbalance in the energy markets as Iran has the capability to restart production almost immediately. A successful outcome for these negotiations could happen instantaneously and presents a legitimate risk for anyone committed to long exposure to crude oil futures or the actual product itself.
- EU negotiations with Iran: More than 15 months have been invested between the U.S. and Iran to revive the 2015 nuclear deal. It is reported that EU officials have submitted a final text for Tehran to sign. In the event this actually happens, it would have the same aforementioned bearish implications for Oil prices.
|
- EU Winter Energy Supply: Russia could weaponize its energy supplies to EU countries for the upcoming winter in response to sanctions imposed against it as well as the military and financial aid it is providing Ukraine to thwart its invasion. If so, energy prices could explode higher.
- Analysts’ Downgrades and Revisions: As the Fed continues to tighten, another wave of negative earnings revisions would require recalibration of equity market valuations.
- Global Food Inflation and Famine: Russia vs Ukraine conflict has the potential to destabilize food supplies and create a domino effect of food inflation and famine in LDCs as well as more developed countries.
- Mid-term elections: The outcome of the upcoming election in November is uncertain and given the divided state of the US, it could bring about more uncertainty and exacerbate the gridlock for which Washington DC is notorious.
|
More By This Author:
TMI Market Notes: Market Gets High on the Latest CPI
Qualifying and Quantifying Current Equity Market Risks
Weekly Capital Markets Technical Analysis Summary: June 2, 2017
Disclosure: JCH Investment Advisory and Consulting Services, Technically Macro Insights LLC (“TMI”), or its affiliates may own positions in the equities or securities mentioned in ...
more
Disclosure: JCH Investment Advisory and Consulting Services, Technically Macro Insights LLC (“TMI”), or its affiliates may own positions in the equities or securities mentioned in this report. Lastly, note that no form of compensation is received from any of the companies covered in this report.
Disclaimer: This report is not distributed for the purpose of providing individualized market advice. The information published in it regards securities in which it is believed that readers may have interest and this report only reflects sincere opinions on the investment markets and events or news impacting them. Nevertheless, this report is not intended to be personalized recommendations to buy, hold, or sell securities. Investments in the securities markets, and especially in options or futures, are speculative and involve substantial risk. Each individual investor should determine their respective appropriate level of risk. It is recommended that you seek personal advice from your professional investment advisor and conduct further independent due diligence research before acting on any information published in this report. Most of the content contained herein is derived directly from information published by the companies mentioned in this report and/or from other sources deemed to be reliable, but without independent verification of such. Therefore, no assurance of the completeness or accuracy of information contained within is guaranteed and in no manner warrants or guarantees the success of any action which you take in reliance on its statements and opinions.
less
How did you like this article? Let us know so we can better customize your reading experience.


