Slice It How You Want, Yield Curves Point To Recession In 2023
It’s no secret that I have been steadfast this year that the U.S. economy has not been in recession. And yes, I do know that both Q1 and Q2 saw negative GDP growth. It doesn’t matter. That’s not a recession. Sorry. And I am not going to feed into the political nonsense regarding the definition of recession. The National Bureau of Economic Research is the final arbiter of recessions, neither politicians nor pundits.
Anyway, my economic forecast for 2023 isn’t as sanguine. All year I have seen risk rising for a recession next year and the calendar turns in one month. I have long written about the yield curve which is nothing more than the difference between two interest rates. You subtract the shorter-term rate from the longer-term one.
For the economy, the best position is a steep and rising curve, meaning that the difference is large and growing. Banks borrow cheaply and lend expensively and that puts a lot of money on the street. Today, we have the exact opposite. The yield curve is inverted, meaning that shorter-term rates are higher than longer-term rates. Banks have a disincentive to lend and money becomes tighter or more restrictive.
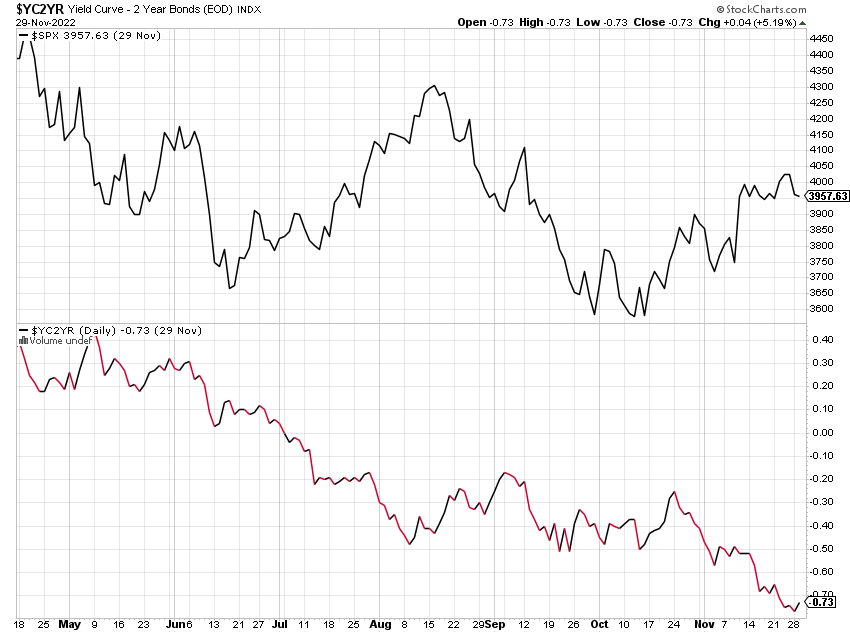
When looking at the yield curve, you can really take any two interest rates. There are so many. The media focuses mostly on the two-year and 10-year which has been inverted since July and deeply so. That’s the lower chart below with the S&P 500 above.
(Click on image to enlarge)

Yield curve inversions are a horrible timing tool for the stock market. Counterintuitively, investors are often better off buying a deeply inverted curve than selling.
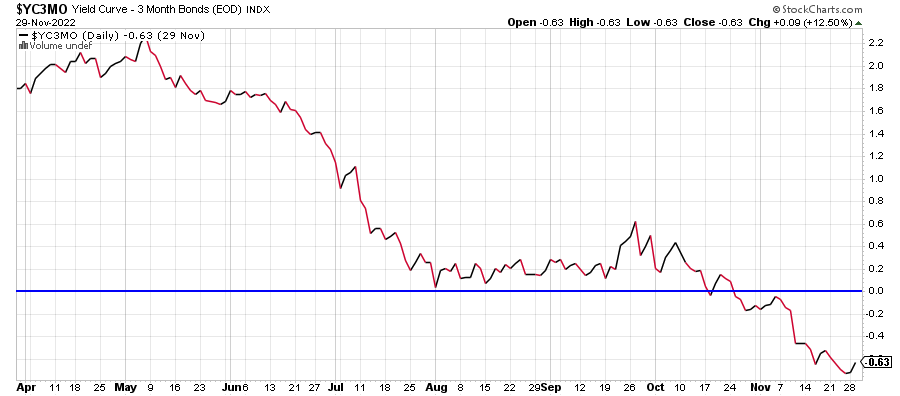
Rather than focusing on what everyone else does, I like to look at the 90-day and 10-year yield curve as well as a mash-up of many yield curves. The 90-day / 10-year is below and it recently inverted in October. That’s an important nail in the coffin for the economy, but not the final one.
(Click on image to enlarge)

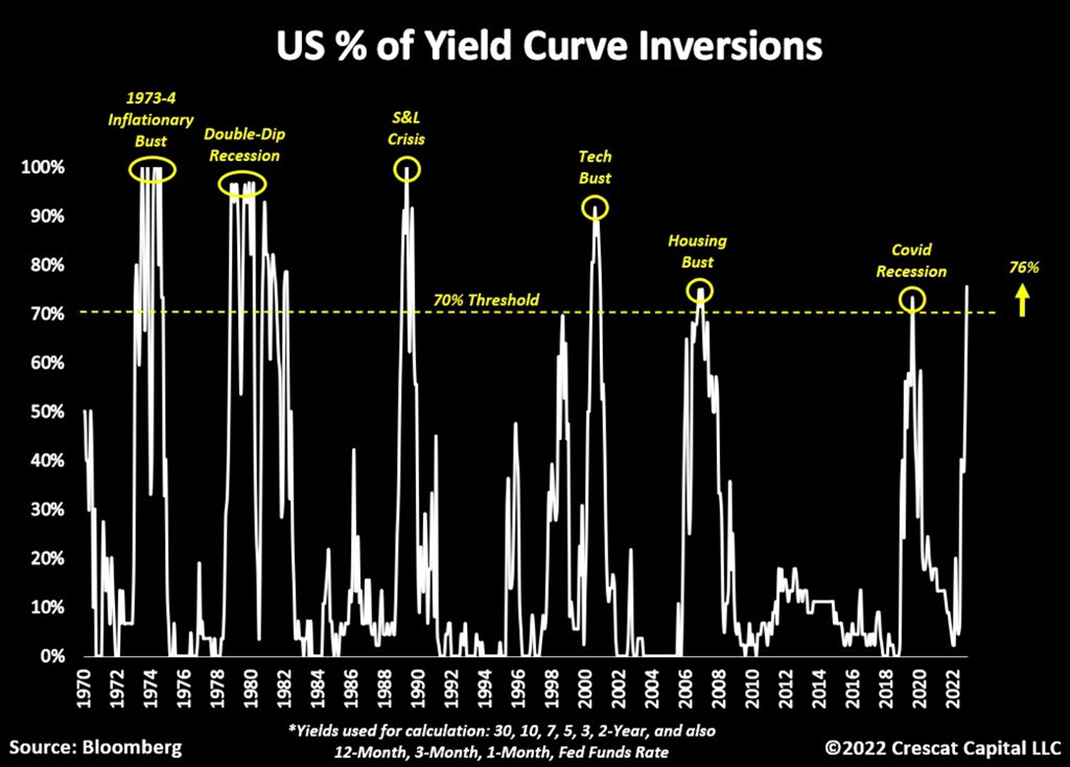
I came across the chart below last week from Crescat which shows a mash-up of all relevant yield curves. The white line shows the percent of yield curves that are inverted. That 70% line is key. Since 1970 every trip above 70% has led to some type of recession. It is now at 76%.
(Click on image to enlarge)

The question for the markets isn’t whether or not recession is coming. The odds heavily favor that. The question is: have we already seen to peak in market-controlled interest rates, the dollar, and a bottom in stocks?
To be continued. Stand by.
On Monday we sold some levered NDX. On Tuesday we bought more levered NDX.
More By This Author:
Seasonal Headwind Today As Black Friday & Cyber Monday Get Weighed
The Pieces Are Falling Into Place
Europe & Dow Showing Emerging Index Leadership As Dollar Plummets
Please see HC's full disclosure here.


