
Minor Island Top
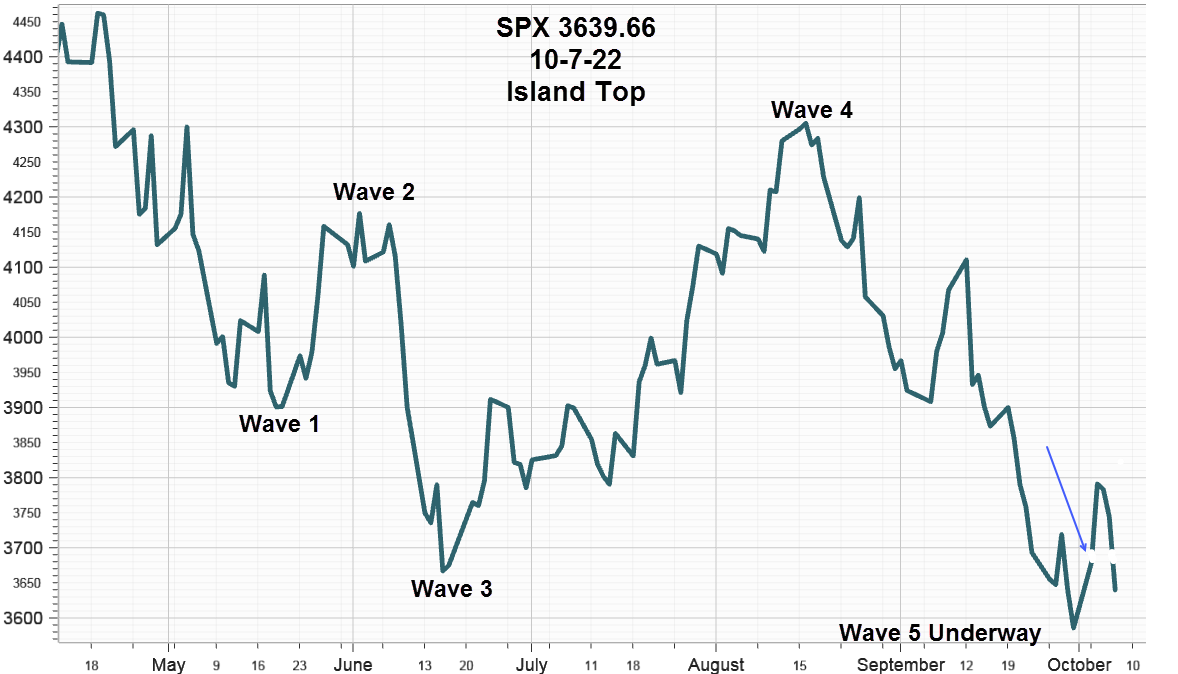
After opening gap higher and romping up last Tuesday, the S&P 500 Index opened gap lower on Friday creating an Island Top with a measuring objective back down at the low made on Friday, September 30, at 3584.13 retracing the oversold bounce move that preceded it.
S&P 500 Index (SPX) 3639.66 added 54.04 points or +1.51% last week as it dutifully bounced up on Tuesday after being oversold and closed an open down gap from Friday, Sept 23. Propelled by a weak ISM PMI Manufacturing Index on Monday followed by encouraging JOLTS job vacancy numbers on Tuesday the bears scrambled to cover short positions setting set off a bad news good news paradox hoping that weaker economic news may slow rate hikes. It ended abruptly on Friday after the employment report.
The blue arrow on the chart below shows the exhaustion gap created on Tuesday followed by Friday's breakaway gap created by a lack of vested interest in the prices within the exhaustion gap thereby creating the Minor Island Top. The chart also shows possible Elliott waves from the January 4 high while suggesting a somewhat lower low for the 5th wave now underway.
(Click on image to enlarge)
Interest Rates
For the week, the 10-Year Treasury Note ended at 3.89% up 4 basis points (bps). The 2-Year Note added 8 bps to 4.30% for a 10-2 inversion of -41 compared to -39 the week before. Rates pulled back on Monday after the ISM PMI Manufacturing Index news along with the U.S. Dollar Index then rebounded to close on the high of the day.
Crude Oil
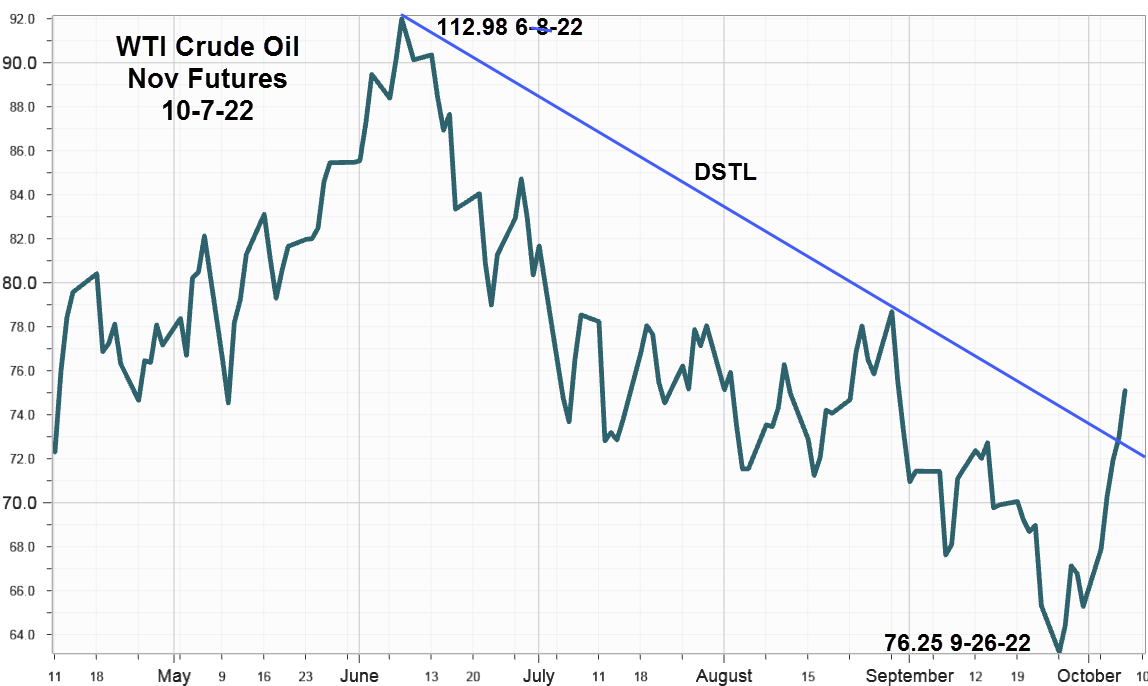
WTI crude oil started the week up strong on speculation that OPEC+ would announce reduced production allocations at their Wednesday meeting just in time for the early October seasonal advance that typically fades away in November and December.
Indeed OPEC+ announced lower allocations by 2 million barrels a day, however since some members were already producing at lower levels the net reduction was estimated at somewhere around 700K barrels a day. By the end of the week, November futures had advanced 13.15 points or +16.54% ending at 92.64. From a technical perspective, it closed above the downward-sloping trendline ( DSTL) from the June 8 high at 112.98. Unless it quickly pulls back and closes below the trendline, the usual year-end seasonal decline will be about as certain as next week's weather forecast.
(Click on image to enlarge)
Market Breadth as measured by our preferred gauge, the NYSE ratio adjusted Summation Index that considers the number of issues traded, and reported by McClellan Financial Publications slipped slightly, declining just 31.61 points last week to end at -974.25. While low and discouraging for the bulls, the slowing rate of decline suggests a pause ahead of Q3earnings reports to soon fill the headlines.
Implied Volatility
SPX options implied volatility index, IVX added just +.31% last week to end at 27.86% with Calls at 27.85% and Puts at 27.87%.
(Click on image to enlarge)
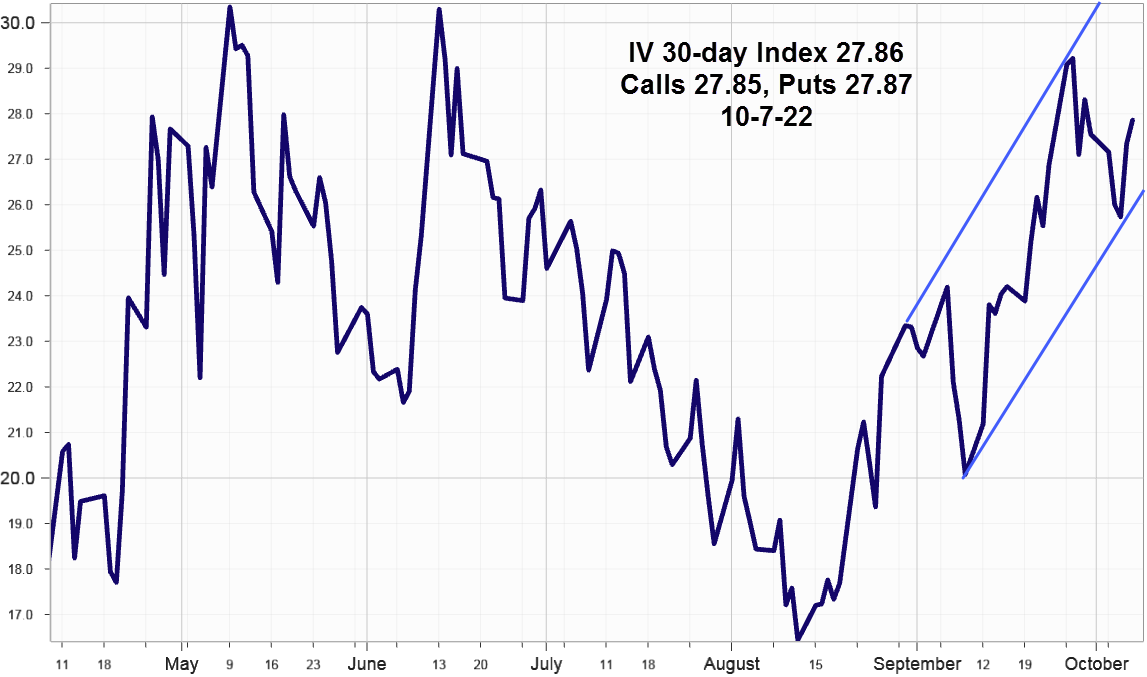
After declining Wednesday implied volatility advanced Thursday ahead of Friday's employment report then continued slightly higher Friday in an upward sloping channel suggesting further advances.
Summing Up
After quick bout of short covering on Tuesday following the ISM PMI and Jolts reports, Friday's employment report quickly changed the picture once again as the S&P 500 Index gapped lower at the open creating a Minor Island Top with a measuring objective back down at 3584.13.
Although interest rates increased slightly last week, the U.S. Dollar Index rebounded to a new high on Friday adding down pressure on equities. Watch for the September Producer Price Index on Wednesday followed by the Consumer Price Index on Thursday.
In response to lower OPEC+ production allocations, November futures advanced 13.15 points or +16.54% closing at 92.64 and well above the operative downward sloping trendline. Crude oil demand due to energy shortages in Europe this winter could support prices enough to offset typical year-end seasonal declines.
Q3 earnings reports along with guidance updates start on Thursday.
More By This Author:
Not Much At Surface Level, More To See Underneath
New Low No Big Deal
Let’s Look At AAPL
Disclaimer: IVolatility.com is not a registered investment adviser and does not offer personalized advice specific to the needs and risk profiles of its readers.Nothing contained in this letter ...
more

