
Let’s Look At AAPL
Stocks reacted positively to news that the Bank of England would step into the Gilts market to try and calm fears provoked by the recently announced mini budget from the UK Treasury. The most obvious reaction was seen in long Gilts with 20yr bond yields moving from around 5% prior to the announcement to sub 4% afterward (FT).
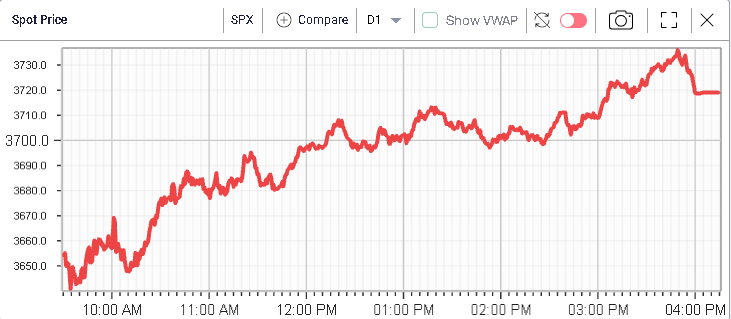
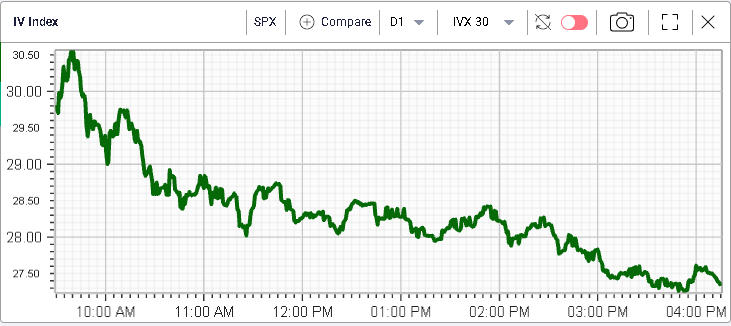
The SPX, the NDX, and the DJIA pretty much all finished up 2% on the day in a bottom left, top right type of day that was pretty much entirely reflected in implied volatilities.
Looking at sectors, the energy segment did the best over the day gaining around 4.5%, a move that was roughly in line with the move in Crude Oil (USO +4.2%). The Communications space also did relatively well gaining 3.4% on average.
Laggards were found in the Tech space which gained around 1.06%. Utilities and Consumer Staples also underperformed gaining 1.07% and 1.2% respectively.
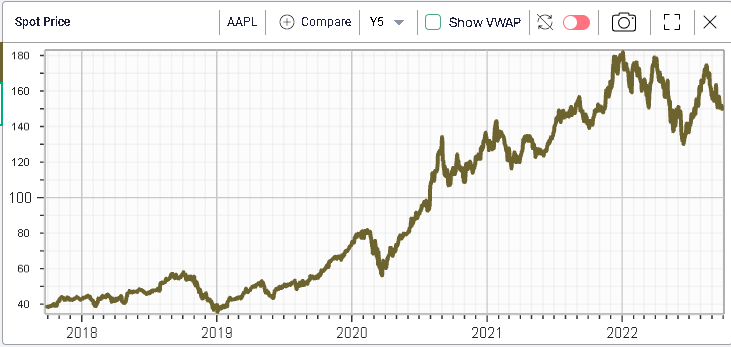
AAPL was the only component of the DJIA to finish in the red. The name lost 1.27% following media reports indicating that the demand for iPhone 14 was failing to reach expected levels (CNBC) forcing Apple to ask suppliers not to increase production.
The stock has lost around 18% this year but continues to show some stellar performance over longer periods of time with 5 years return seen at 289%.
Implied volatility in the name has moved higher, pretty much in line with the broader market, and is now around 40%, its highest level in 2022.
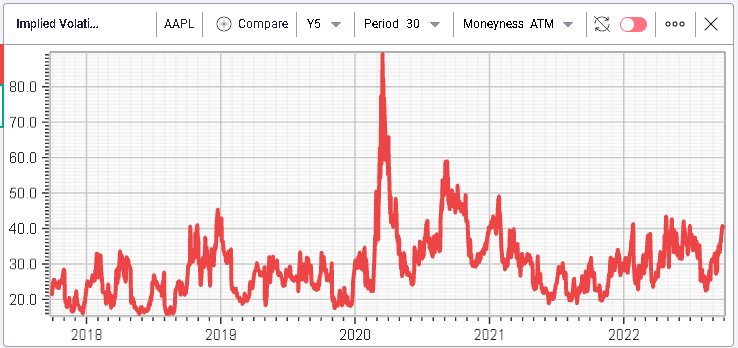
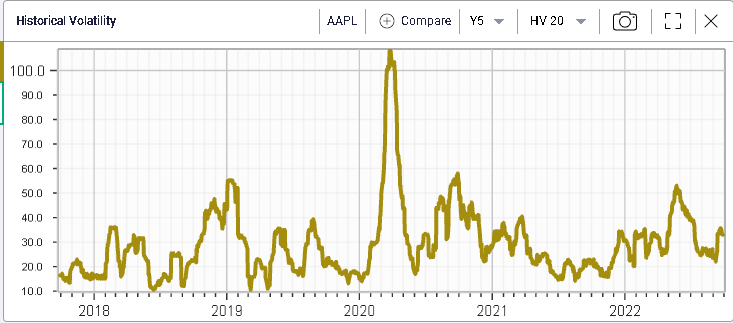
This is happening with historical volatility remaining fairly subdued (compared with prior episodes) and currently being at 33% when measured over 20 days.
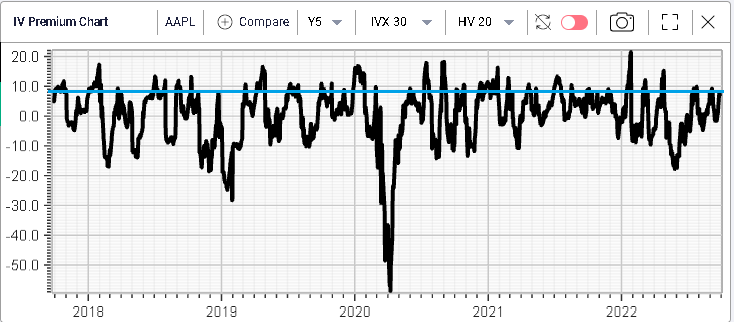
This leaves the IV Premium at fairly elevated levels when measured over the past 5 years with a premium of around 8 vols for the 30d IV ATM relative to the 20d HV.
Volumes in the name have increased recently but remain far off historical levels (especially when compared with SPX volumes as highlighted in Tuesday’s market update).

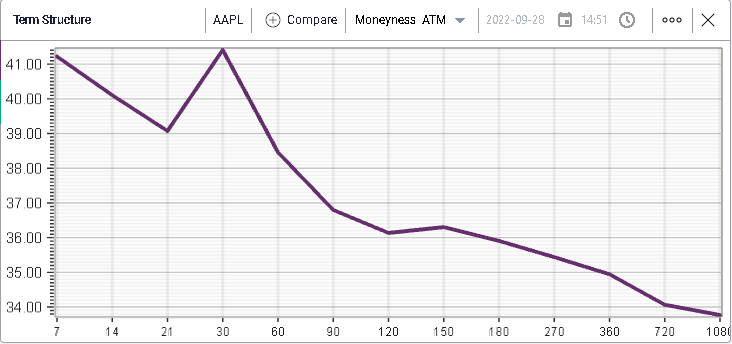
Looking at the current term structure, it is inverted for short-dated options and pretty much all maturities seem to have implied volatilities above the most recently observed realized volatility in the name.
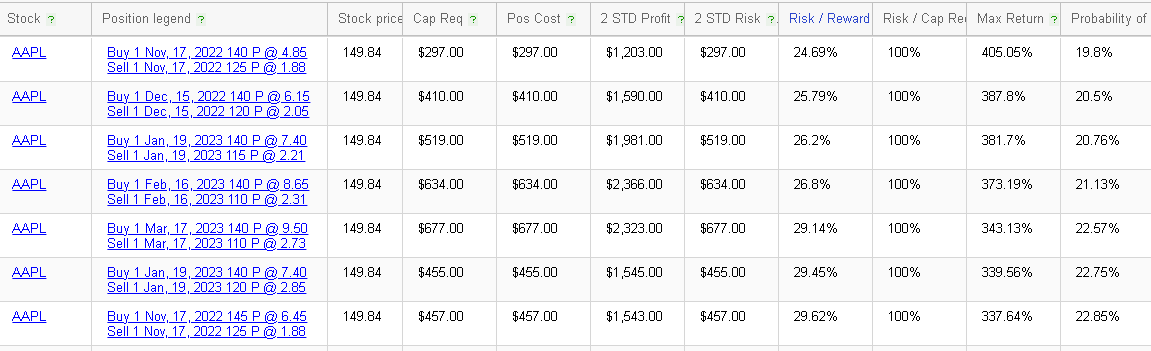
Looking at structures that try to limit the overall volatility exposure of the trader, bull spreads and bear spreads can be quite useful. Calling on the RT Spread Scanner functionalities, we are able to retrieve the following tables displaying the most attractive opportunities from a risk/reward perspective in AAPL both on the upside and on the downside.
(Click on image to enlarge)
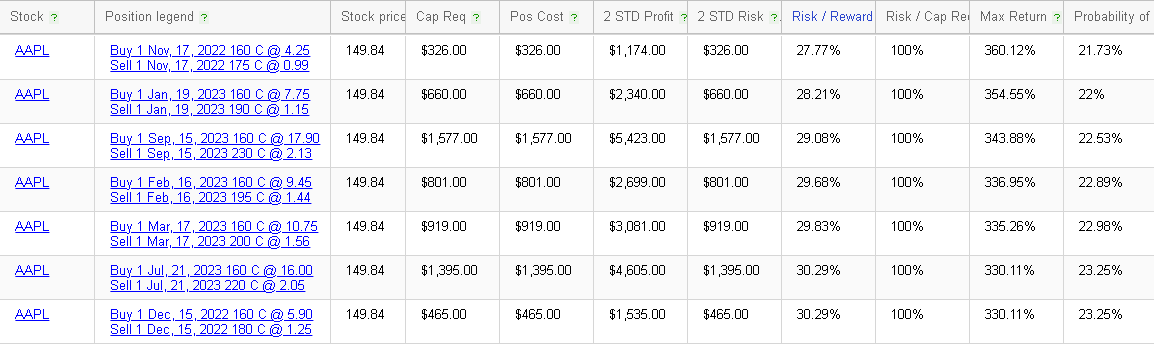
Looking at the above, we can see that, from a risk to reward perspective, the Nov 160 / 175 bull vertical spreads offer the best ratio. It costs around $326 to buy and offers a 2 std profit of $1,174 or a R:R of 27.77%. In other words, for each $28c risked by the trader, the potential gain could be $1.
For bear vertical spreads, the system flags the Nov 140/125 bear-spreads for $297 and offering a potential gain of $1,203 or a R:R of 24.69%.
More By This Author:
Taking Stock Of The FOMC’s Impact
Market Stabilization And A Rate Cut In China
Another Bounce
Disclaimer: IVolatility.com is not a registered investment adviser and does not offer personalized advice specific to the needs and risk profiles of its readers.Nothing contained in this letter ...
more

