
For the S&P 500 Index, last week's pivot right after Labor Day increased the probability for another bear market bounce similar to the one that ended on August 16. As noted in Weakness Abounds many indicators were in oversold territory and could rebound when trading after the holiday resumed.
S&P 500 Index (SPX) 4067.36 bounced up 143.10 points or +3.65% closing above the 50-day Moving Average on Friday at 4030.38, gaining 61.18 points or +1.53%.
Last week's chart showed a close below a new upward-sloping trendline, USTL inaccurately used the closing price for the second pivot not the low on that reversal day. After adjusting, the chart below shows the new upward-sloping trendline USTL with a small arrow near the low on July 14 at 3721.56. Then last Tuesday it made the third pivot off the low at 3866.75 to create the new operative USTL.
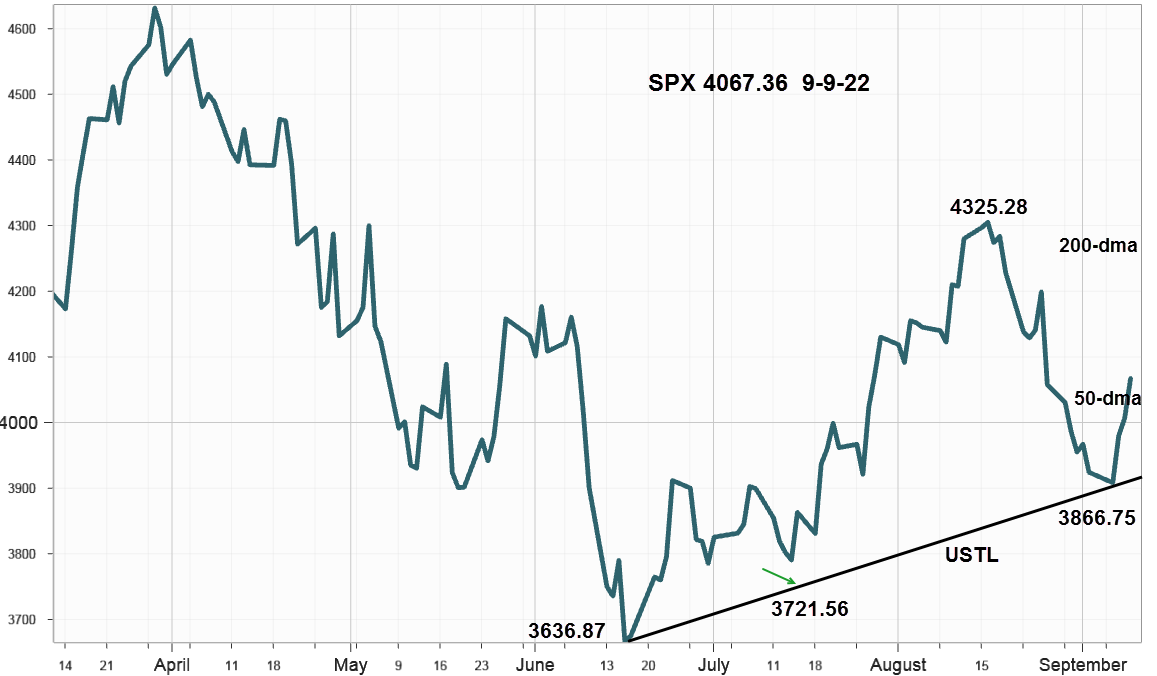
Now above the 50-day Moving Average, the downward-sloping 200-day Moving Average at 4275.49 makes a good next target and is consistent with the bouncing ball principle of topping out below the first bounce. If so, the newly created USTL will play an important role in the next pullback. Friday's gain could reflect speculation that Tuesday's Consumer Price Index data will come in weaker than anticipated thereby relieving some pressure for a 75 basis point hike by the Fed on September 21.
Interest Rates
Last week rates increased across the entire curve with the 10-Year Treasury Note ending at 3.33% up 13 basis points (bps). The 2-Year Note increased 16 bps to 3.56% for a 10-2 spread of -23 bps compared to -20 bps on Friday, September 2 with the 3-month bill at 3.08% up 14 bps. The big event that sparked Friday's SPX gain came from a 75 bps rate hike by the European Central Bank (ECB) that reduced the U.S. dollar rate differential turning the U.S Dollar index lower.
Market Breadth as measured by our preferred gauge, the NYSE ratio adjusted Summation Index that considers the number of issues traded, and reported by McClellan Financial Publications declined another 213.82 points last week to end at -34.06 and a good way below the 50-day Moving Average up at 167.48. Although the rate of decline slowed on Friday until it turns positive this reliable indicator suggests caution.
Implied Volatility
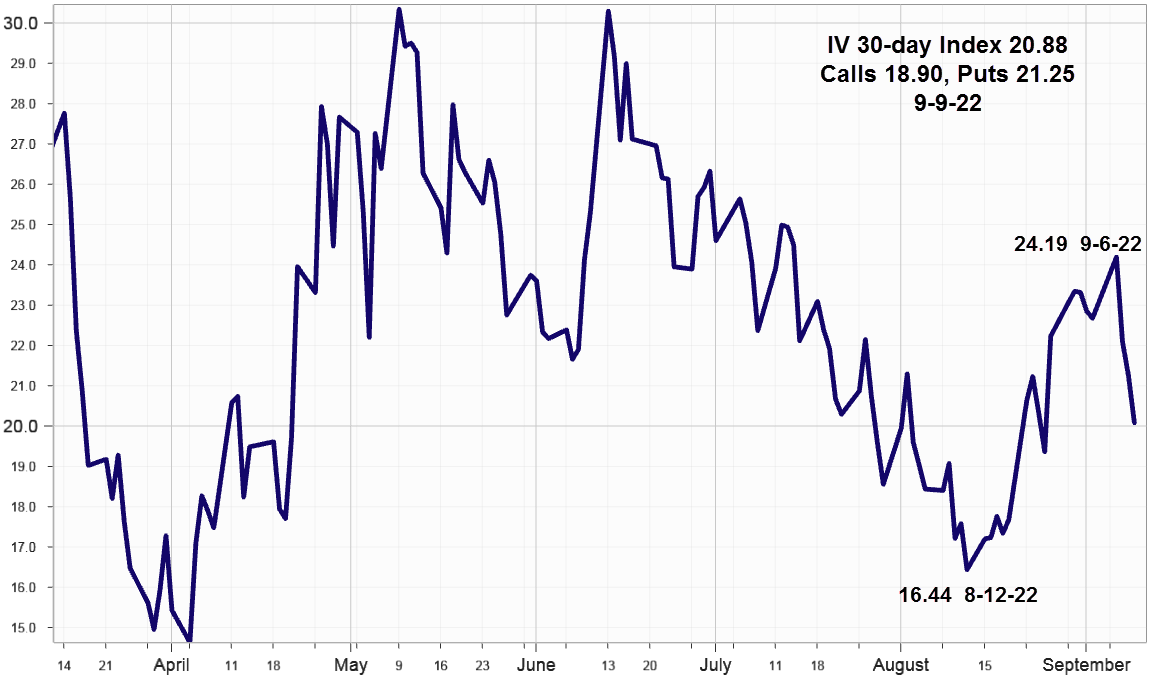
SPX options implied volatility index, IVX declined 1.80% to 20.88% from 22.68% on the week ending September 2 with the Calls at 18.90% and Puts at 21.25% still slightly skewed.
In addition to oversold conditions noted in Weakness Abounds, other sources reported extreme institutional equity only put buying and net put positioning before the Labor Day holiday. For example, on Thursday, September 1, the equity-only put-call ratio peaked at .84, the highest since June 16 at .86, and .89 on June 10. While ratios above .70 are considered high, spikes into the .80s indicated extremes associated with excessive hedging of individual stock positions as well as oversold market conditions.
Crude Oil
WTI Crude Oil declined almost 5% last Wednesday closing below the first support at 85 basis October futures, with the next support at 80, and setting off multiple oversold bounces in several indicators. As one of the leading inflation drivers thoughts turned to less pressure on the Fed for more rate hikes. Energy markets appear to be saying bond yields should be going lower. However, it seems like the 30-year yield at 3.47% up 12 bps for the week reflects the line that without SPR releases crude prices would be higher.
Summing Up
Last week bears began covering their shorts and portfolio managers began unwinding hedges with the SPX at support around 3900 creating the third pivot point for a new (revised) upward-sloping trendline, USTL. With some investigation and with the benefit of hindsight, the oversold condition before the Labor Day holiday turned the tide when crude oil declined and then the ECB hiked rates. The next big event comes Tuesday with the release of the Consumer Price Index. A weaker-than-expected report should boost the SPX as it moves up to test the 200-day Moving Average.
More By This Author:
Banks OutperformWeakness Abounds
Bull Bounce Over
Comments
Log in or sign up to join the conversation.