
Looking At The CoT Report: Who's Buying What
Following futures positions of non-commercials are as of September 24, 2024.
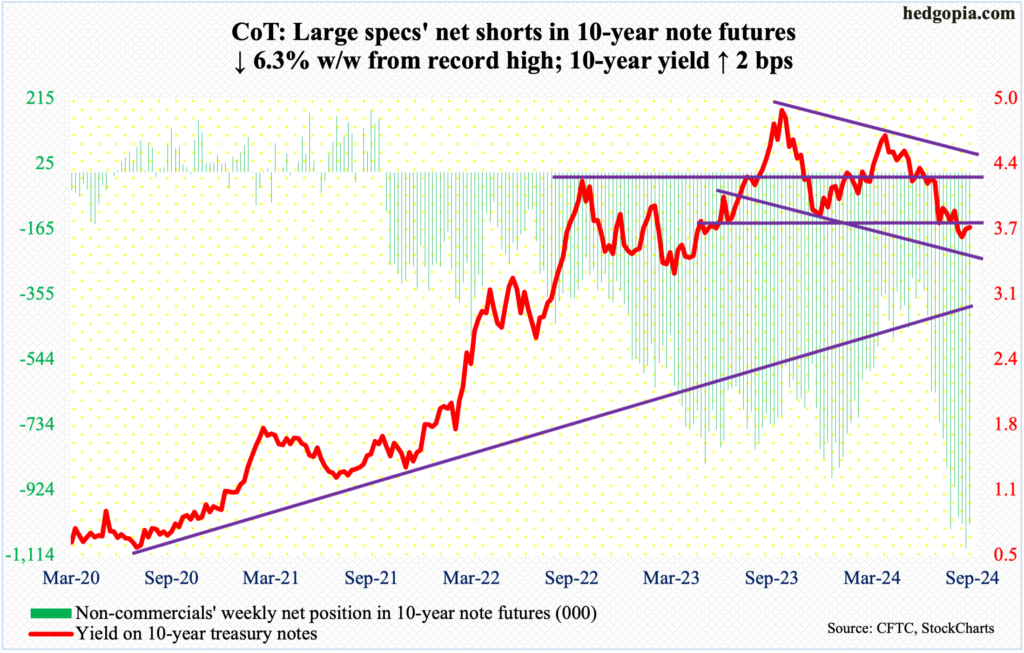
10-year note: Currently net short 1,025.3k, down 68.7k.
In August, headline and core PCE, which is the Federal Reserve’s favorite inflation metric, increased 2.24 percent and 2.68 percent, in that order. Back in 2022, they were growing at four-decade highs of 7.25 percent (June) and 5.65 percent (February). Inflation has come down a lot, with the headline at a 42-week low in August. The core, on the other hand, has a flattish look to it with the last four months at 2.6s and with June’s 2.63 percent at a 40-month low.
Judging by the FOMC’s 50-basis-point reduction in the fed funds rate last week, inflation is no longer a priority for the central bankers. Jobs are. The Federal Reserve operates with a dual mandate of maximum employment and price stability. The latest dot plot foresees two more 25-basis-point cuts this year, followed by 100 basis points’ worth next year – for a total of 200 basis points by the end of 2025. In the futures market, traders are 50 basis points higher, pricing in the rates to reach 275 basis points to 300 basis points by the end of 2025.
Regardless how it resolves in the months and quarters to come, it feels like markets are beginning to expect higher inflation from here on. In other words, they expect the ongoing easing cycle to be inflationary. Before last week’s cut, the benchmark rates were left at a range of 525 basis points to 550 basis points since July last year. Earlier, they were tightened from a range of zero to 25 basis points in March 2022.
Since the easing on the 18th, the 10-year treasury yield has rallied 11 basis points to 3.75 percent, even as its spread with the two-year yield, which tends to be the most sensitive to the central bank’s monetary policy action, widened from three basis points to 18 basis points. The Fed is lowering short-term rates, but the long end of the yield curve is threatening to go the other way. This is precisely what non-commercials are positioned for, with net shorts in 10-year note futures near record highs.
The 10-year faces lateral resistance just under 3.8 percent. Once this gives way, there is trendline resistance at mid-4.2s from April this year, with the 200-day moving average at 4.17 percent. If bond bears (on price) succeed in steamrolling past this hurdle, then we know serious inflation worry is building.
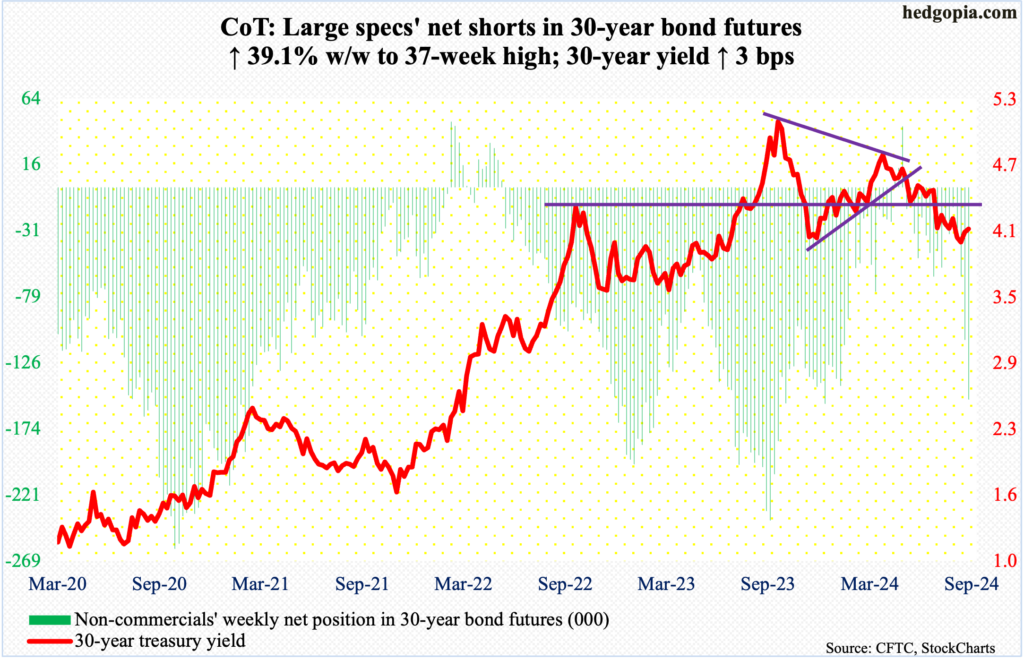
30-year bond: Currently net short 152.6k, up 42.9k.
Major US economic releases for next week are as follows.
The ISM manufacturing index (September) and JOLTs job openings (August) are on schedule for Tuesday.
Manufacturing activity in August rose four-tenths of a percentage point month-over-month to 47.2 percent. This was the fifth consecutive month of contraction after March’s 50.3-percent reading briefly ended 16 months of contraction in a row.
July non-farm openings declined 237,000 m/m to 7.7 million – a 42-month low. Openings peaked at 12.2 million in March 2022.
Thursday brings the ISM services index (September) and durable goods orders (August, revised).
In August, services activity edged up one-tenth of a percentage point m/m to 51.5 percent – a three-month high.
Orders for non-defense capital goods ex-aircraft – proxy for business capex plans – inched up 0.2 percent m/m in August to a seasonally adjusted annual rate of $73.7 billion. Last December witnessed a record $74 billion in orders.
Payrolls (September) are due out Friday. In the first eight months this year, an average 184,000 non-farm jobs have been created. This compares with the monthly average of 251,000 in 2023, 377,000 in 2022 and 604,000 in 2021.
WTI crude oil: Currently net long 172.1k, up 29.9k.
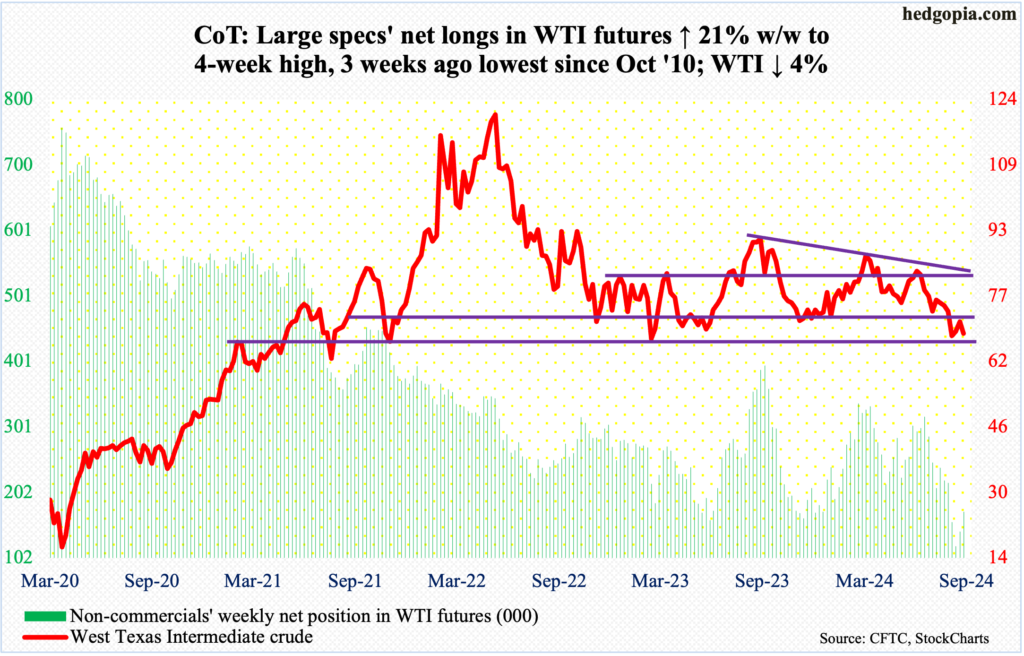
Oil bulls went after a well-established, but broken, range between $71-72 and $81-$82, but to no avail. This continued for five sessions through Wednesday, with Tuesday even tagging $72.40 intraday, but the bulls could not quite pull it off. By the end of the week, West Texas Intermediate crude dropped four percent to $68.18/barrel.
The crude is now down in nine of the last 12 weeks. This week’s drop ended a couple of positive weeks, after it fell to $65.27 intraday on the 10th (this month). Earlier, WTI turned back down after hitting $84.52 in July, preceded by highs of $87.63 in April and $95.03 last September. Given this pattern of lower highs, the breach of $71-72 could prove to be important the longer it stays down. This month’s low has gained in significance, as does the May 2023 low of $63.57.
In the meantime, US crude production in the week to September 20th was unchanged week-over-week at 13.2 million barrels per day. In August, weekly output hit a record 13.4 mb/d twice. Crude imports increased 134,000 b/d to 6.5 mb/d. Stocks of crude, gasoline, and distillates all dropped – by 4.5 million barrels, 1.5 million barrels and 2.2 million barrels respectively to 413 million barrels, 220.1 million barrels and 122.9 million barrels. Refinery utilization declined 1.2 percentage points to 90.9 percent.
E-mini S&P 500: Currently net short 35.8k, down 87.2k.
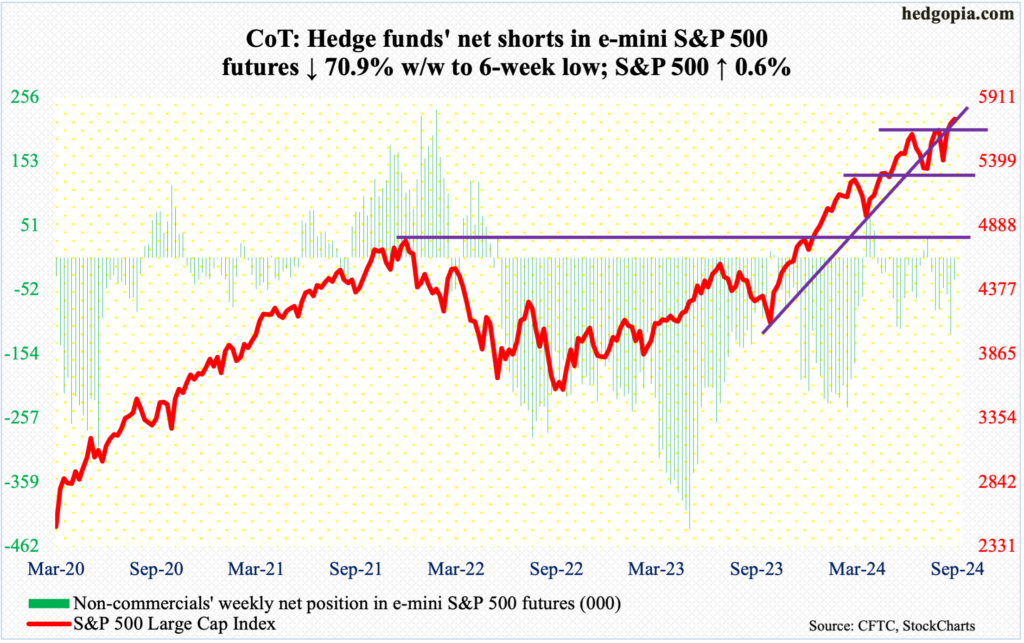
The S&P 500 trudged higher 0.6 percent this week to 5738. This follows last week’s breakout in the wake of the FOMC’s decision to lower the fed funds rate by 50 basis points. No sooner did the large cap index break out of 5670s last Thursday – 5670 on July 16 and 5671 on September 17 – than a retest occurred on Friday – successfully. But action since has been listless.
This Thursday, in fact, the S&P 500 rose as high as 5767 but only for sellers to appear. The index is regularly posting new highs, but momentum is not cooperating. The daily RSI ended the week just north of 64. On its way to the July peak in the S&P 500, the metric persisted over 70 – even low-80s at one time – for a month before going sub-70. It has not hit 70 since.
As things stand, breakout retest at 5670s – at least – is the path of least resistance for next week.
Euro: Currently net long 71.7k, up 2.1k.
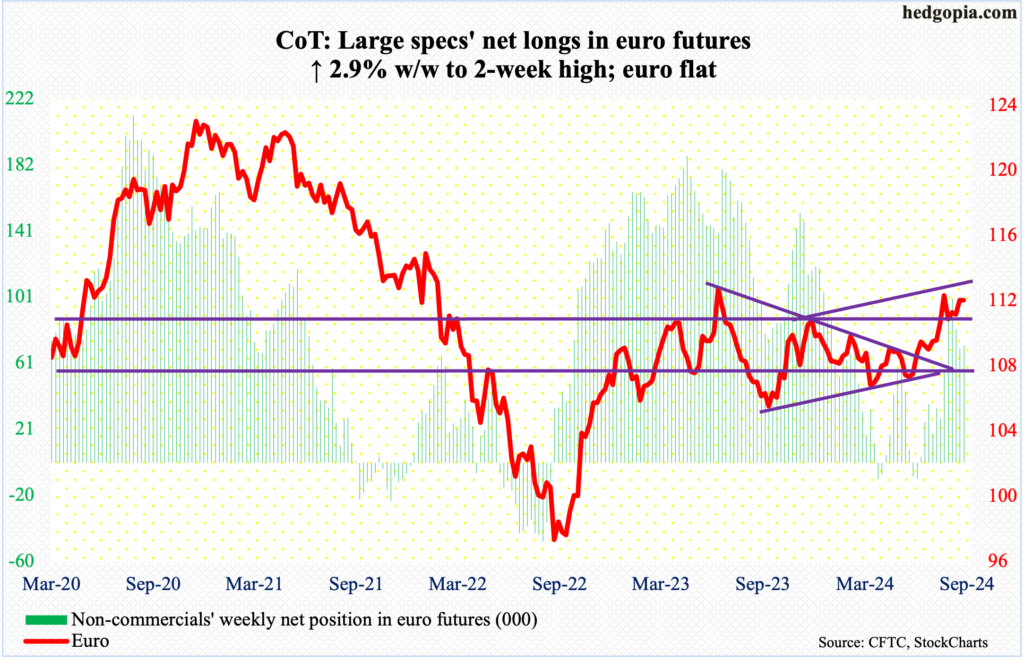
The euro went flat, closing the week at $1.1164, with a wide range of $1.1214 and $1.1083. This makes it a fifth consecutive week euro bulls have been denied at $1.12. A breakout – should one occur – will carry a powerful message. The euro bottomed at $1.045 last October and has since posted higher lows – $1.06 in April and $1.066 in June.
Horizontal resistance at $1.10 was taken care of six weeks ago. If euro bulls fail to break out of $1.12 right away, $1.10 is another place where they can regroup and launch another attack.
Gold: Currently net long 315.4k, up 5.3k.
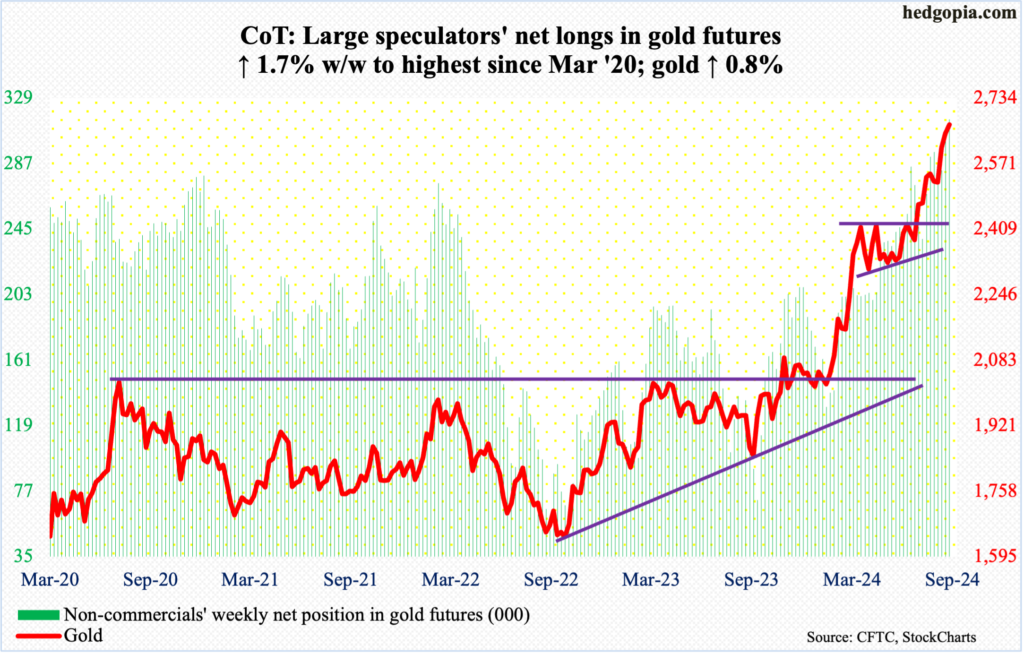
Gold rallied another 0.8 percent this week to $2,668/ounce but not before raising a caution flag. It touched $2,697 intraday Thursday before profit-taking began.
Last week, after five sessions of sideways action at $2,610s, gold broke out Friday; this followed a breakout in the prior week at $2,540s-50s after several unsuccessful attempts since mid-August. The metal has experienced a sustained rally from $2,305 this June, including an August breakout at $2,440s-50s after more than three months of sideways action.
This week’s shooting star candle probably is a warning that gold is ready for a breather. Immediate support lies at $2,610s, followed by $2,540s-50s and $2,440s-50s.
Nasdaq (mini): Currently net long 16k, down 3.2k.
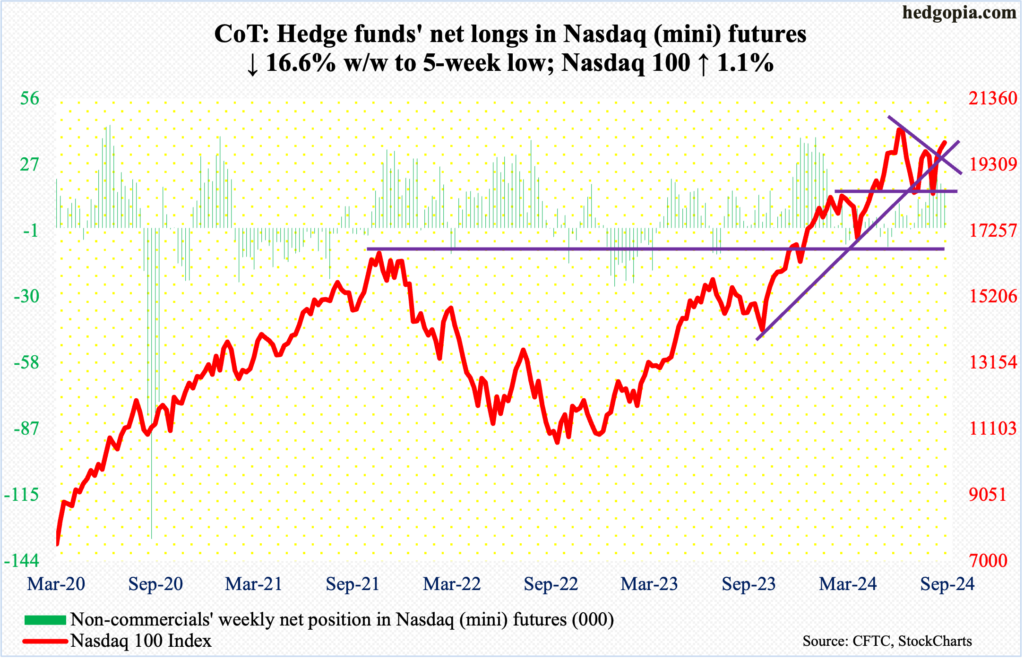
At long last, the Nasdaq 100 filled the July 17th gap at 20200s, and this immediately attracted sellers. Thursday, the tech-heavy index tagged 20273 intraday but only to close at 20116. Friday, it dropped to 20009, up 1.1 percent for the week. The index remains 3.4 percent from its record high posted on July 10.
As is the case with the S&P 500, the daily on the Nasdaq 100 is itching to move lower.
Immediately ahead, there is horizontal support at 19900s, which likely gets breached. The 50-day lies at 19227.
Russell 2000 mini-index: Currently net long 21.9k, up 18.9k.
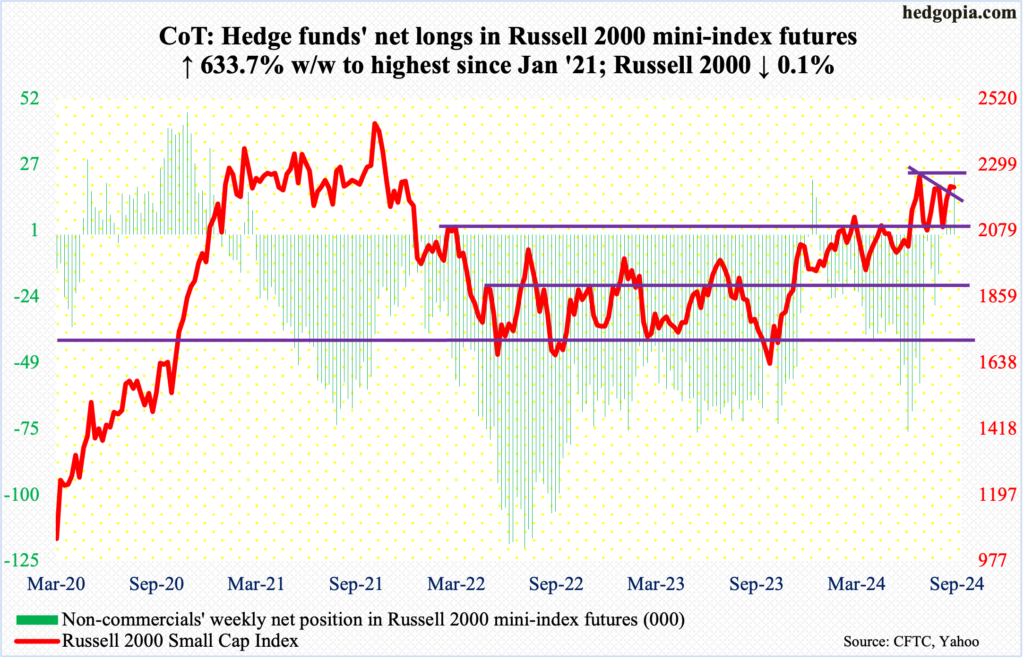
The Russell 2000 edged lower 0.1 percent this week to 2225, and not a whole lot changed from last week.
Last week, the small cap index broke out of a month-and-a-half symmetrical triangle and then faced resistance just under 2260s. Horizontal resistance at 2260s goes back to mid-July, and it is a must-win for the bulls.
US Dollar Index: Currently net long 959, down 839.
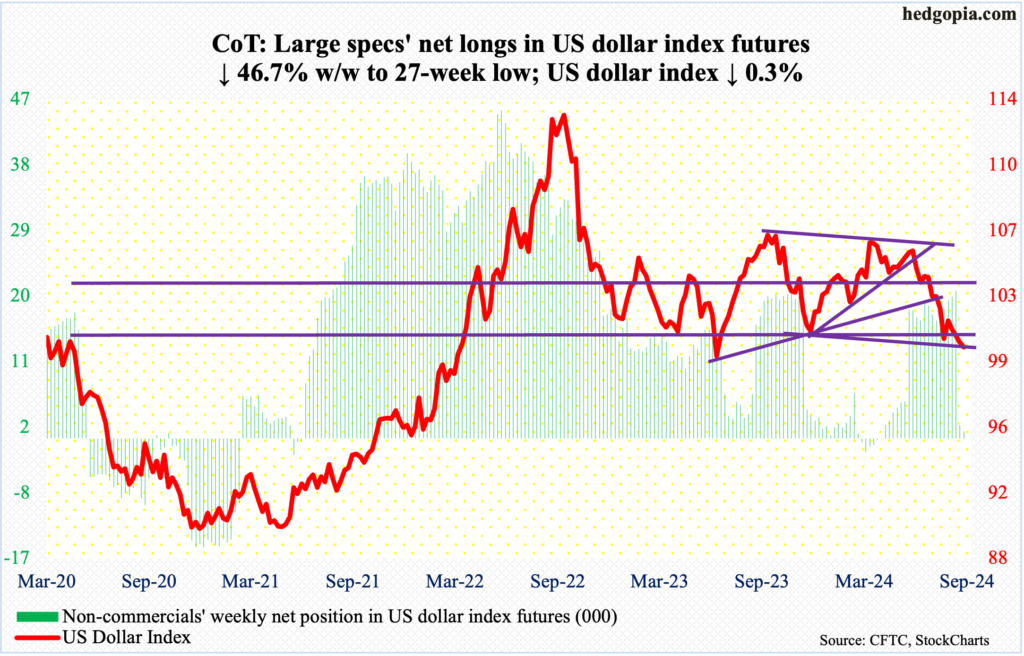
Non-commercials remain net long, but barely, having cut net longs from 20,210 contracts three weeks ago to 959. It feels like they fear the US dollar index is headed for a breach of crucial horizontal support at 100-101, which goes back years.
This week, the index dropped to 99.86 intraday Friday before crawling its way back to 100.11, down 0.3 percent for the week. This was the fourth weekly decline in a row – and ninth out of the last 13. The index has been under pressure since ticking 105.80 in June; this was preceded by highs of 106.38 in April and 107.05 last October, establishing a pattern of lower highs. Hence the significance of 100-101 and the must-save 99.22 from July last year.
VIX: Currently net short 5.1k, down 1.4k.
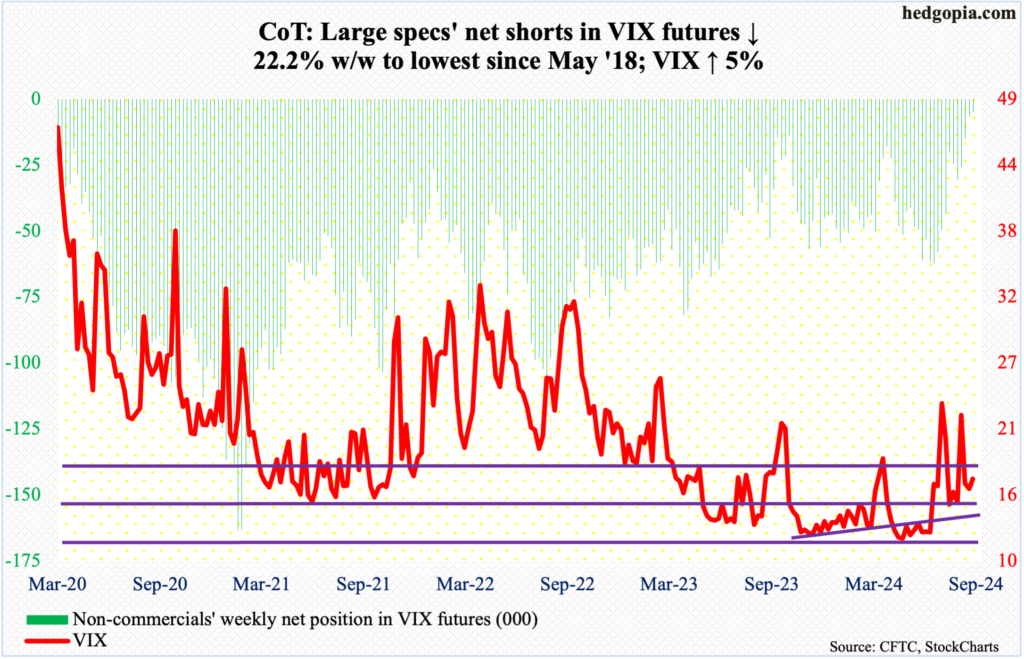
The 200-day was tested – successfully. VIX has not breached the average for two months. This week, the volatility index fell as low as 14.90 on Thursday before rallying firmly on Friday to end up 0.81 points to 16.96, for a bullish weekly hammer. VIX tends to go the opposite way of the S&P 500. This week, they both rallied.
The daily is itching to rally.
On the weekly, the RSI is turning up at the median, which the metric has not breached for nearly three months.
If all this adds up to strength in volatility near term, non-commercials’ positioning in VIX futures are worth a watch. Historically, VIX tends to peak as these traders either go long or get close to doing that. This week, they were only net short 5,067 contracts, which is the lowest since May 2018. The last time they were net long was January 2019, when they remained net long for 11 weeks; in 2018, the S&P 500 had a tough October-December losing just north of 20 percent.
Thanks for reading!
More By This Author:
S&P Rallies To New High A Day After FOMC Decision; Last 3 Daily Candles Raise More Questions Than AnswersWhat The Latest CoT Report Tells Us About Who's Buying What
Major US Equity Indices Looking At Breakout Opportunities – Potentially Major On S&P 500
This blog is not intended to be, nor shall it be construed as, investment advice. Neither the information nor any opinion expressed here constitutes an offer to buy or sell any security or ...
more

