
The S&P 500 sits less than a percent from its July high and is positioned well for a breakout. The Nasdaq 100 and the Russell 2000 are nowhere near their respective highs, but they too have breakout opportunities to add to last week’s gains.
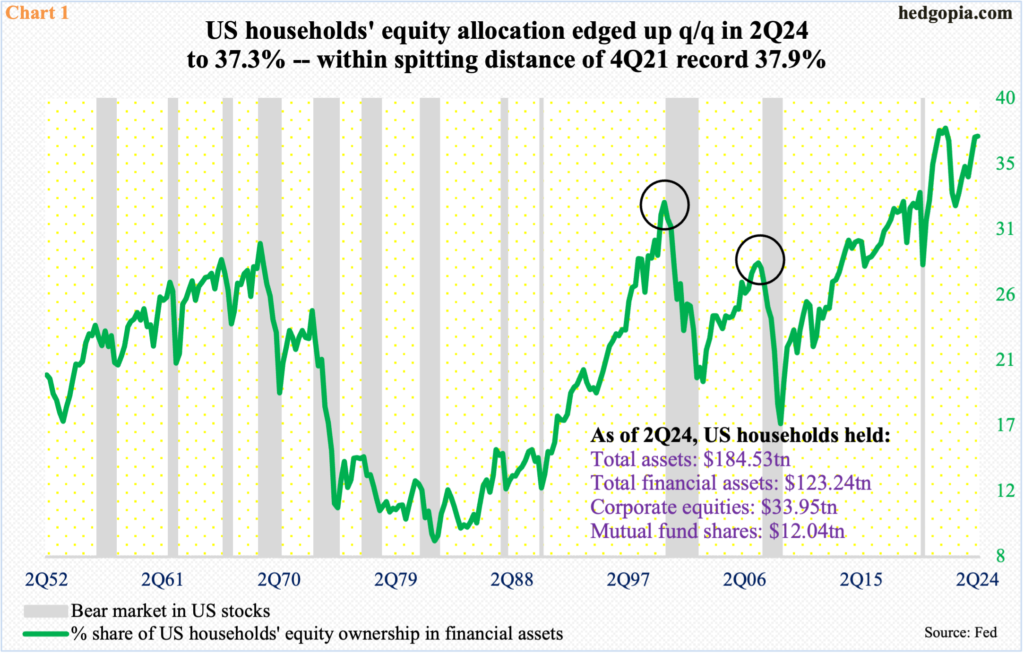
In the June quarter, US households’ equity allocation edged up sequentially to 37.3 percent. The metric reached a record high 37.9 percent in 4Q21. After that high, household ownership dropped to 32.4 percent in 3Q22 before reasserting itself.
Unlike the prior major peaks – 32.6 percent in 1Q00 and 28.4 percent in 2Q07 (black circles in Chart 1) – household ownership this time around has sustained at an elevated level. It has been in the 30s for 17 quarters in a row.
The 2000 and 2007 highs eventually led to a bear market. As elevated as the current readings are, this is yet to happen. When – not if – a bear market begins, the decline has the potential to be more painful as there is a lot more unwinding left to do.
(Click on image to enlarge)
Looking at the S&P 500 on a monthly chart, one gets the impression that indicators such as the RSI and the CCI are getting ready to turn lower. Should that unfold, unwinding of the overbought condition the large cap index is in will take a while. The last time the CCI for instance dropped from overbought to oversold level was in 2022 when the S&P 500 came under pressure from January to October, for a 27.5-percent peak-to-trough tumble.
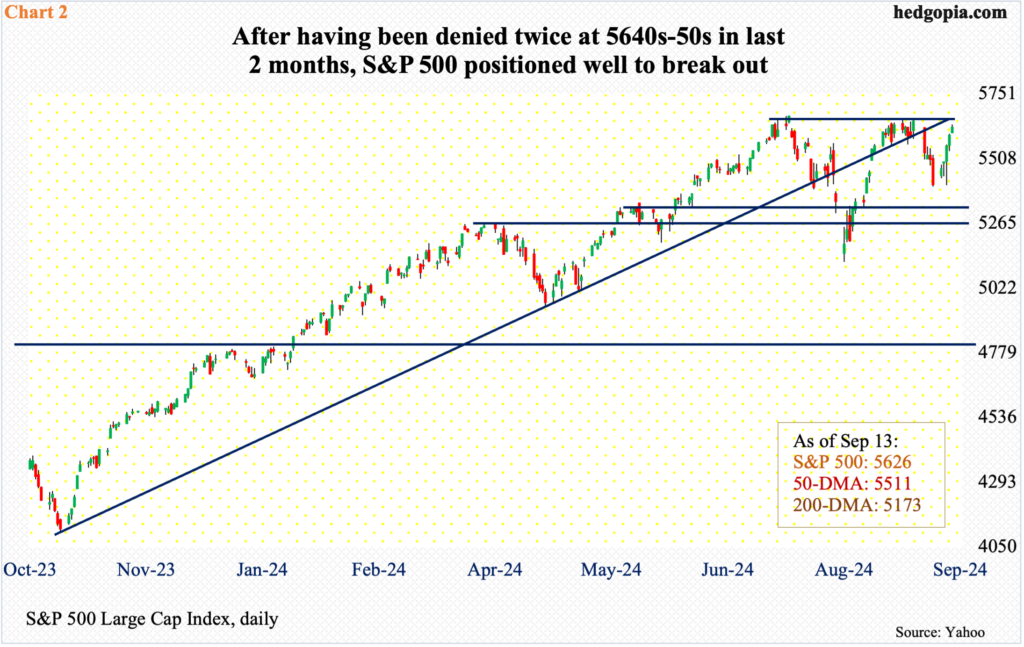
As things stand, the index is merely 0.8 percent from its record high from July, when it peaked at 5670 on the 16th. Since then, it fell twice – 9.7 percent over 15 sessions in July-August and 4.3 percent over eight sessions in August-September. Both were bought before things could begin to unravel.
As a matter of fact, large-cap bulls are currently staring at a breakout opportunity at 5440s-50s. In the last couple of months, this price point acted as a roadblock twice. Last week’s four-percent advance to 5626 once again positions the S&P 500 just under that resistance (Chart 2). A breakout looks imminent. More important is what happens after the breakout. By then, the Federal Reserve would have begun an easing cycle, and many times in the past this has set in motion a ‘sell the news’ phenomenon.
(Click on image to enlarge)
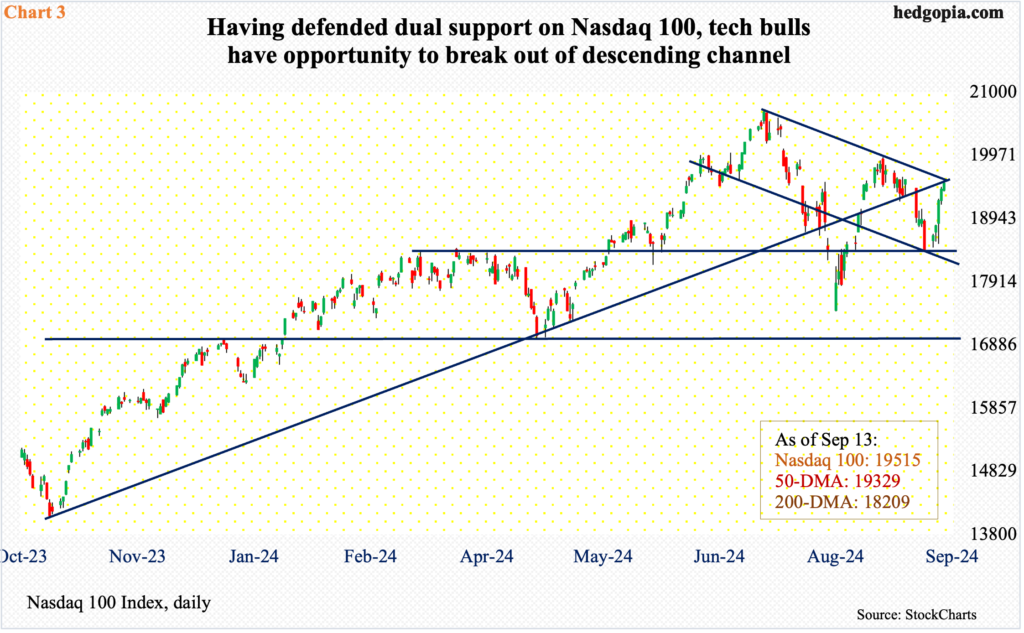
Arguably, this has already begun on the Nasdaq 100, which peaked at 20691 on July 10, followed by a 15.7-percent swoon by August 5. A distinct lower high was ensured when the tech-heavy index retreated on August 22 at 19939 before bottoming on the 6th this month at 18401 for a 7.7-percent drop.
Unlike the S&P 500 which is less than a percent from its July high, the Nasdaq 100 needs to rally another six percent before it approaches its high from July. With that said, it too does have an opportunity to stage a breakout and add to gains of last week.
Defending dual support – channel and horizontal – and rallying in all five sessions last week for a 5.9-percent increase, it closed last week right at the top of the channel as well as the underside of a broken trendline from last October (Chart 3).
A breakout here should open the door toward 19900s, followed by gap-down resistance at 20100-20300.
(Click on image to enlarge)
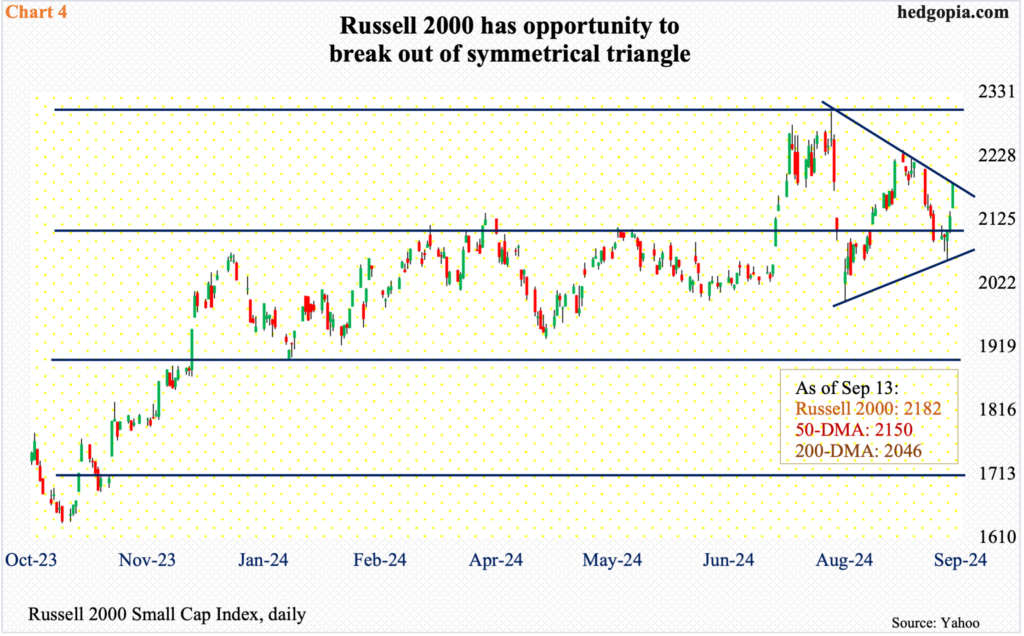
A similar opportunity awaits the Russell 2000, which remains substantially below its November 2021 record high of 2459. Last week, the small cap index rallied 4.4 percent to 2182 – back above 2100, which it broke out of on July 11. Prior to that, the index last December broke out of a 1700-1900 range, which had been in place since January 2022.
After the 2100 breakout in July, the Russell 2000 hurriedly added another 200 points, tagging 2300 on the 31st that month, before reversing lower. In the back-and-forth action that followed, the Russell 2000 has fashioned a symmetrical triangle, the upper trendline of which goes back to the 2300 high (Chart 4). A breakout here likely clears the way toward 2260s, which acted as a ceiling in the second half of July, including the intraday reversal on the 31st.
The point in all this is that all these three indices are looking at technical opportunities that can result in more gains in the near-term. Chart 1 is a medium- to long-term worry for the bulls.
More By This Author:
CoT On The Future Through Futures, Hedge Funds PositioningFutures Traders Expect 250 Basis Points Of Easing In Next 1 Year – Equities Not Buying It
Equity Longs Come Up Short, Fail To Exploit Decent Breakout Opportunity On S&P 500


Comments
Log in or sign up to join the conversation.