Equity Bulls Later Last Week Used Bad Data To Load Up On Stocks, More Gains Likely Ahead
Last Thursday, bulls used the initial weakness in major equity indices owed to the 4Q22 productivity report as an opportunity to buy. Friday, they bought more. More gains are likely ahead.
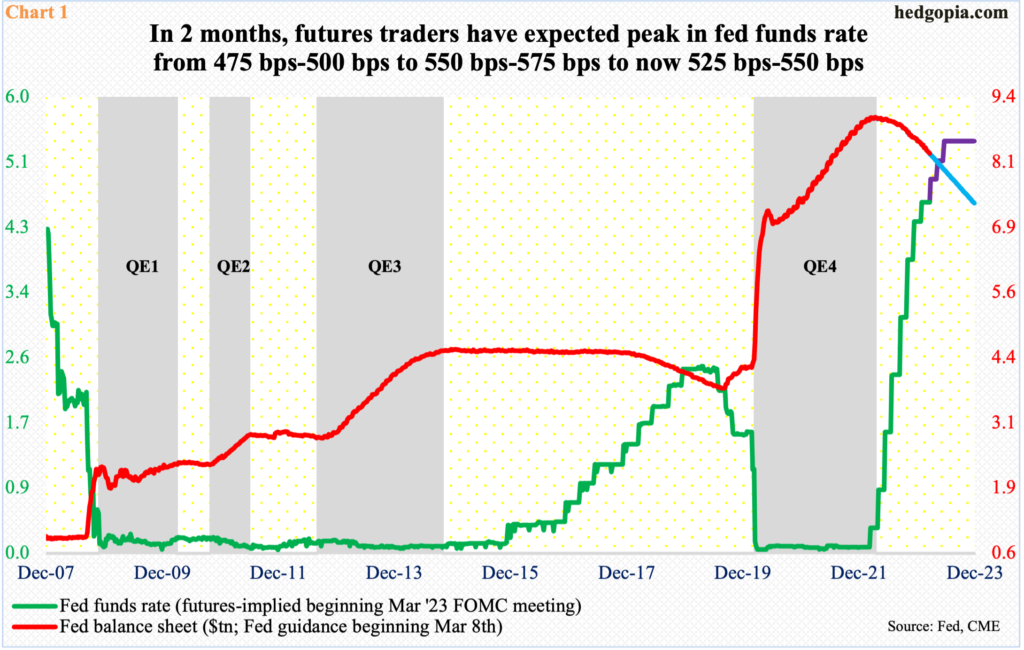
Fed funds futures are very volatile. Traders are actively reacting in real time to any piece of macro data particularly pertaining to inflation, wages, and jobs, as they do to statements of FOMC members – both voting and non-voting – who waste no opportunity to make their views public.
Until about two months ago, most investors believed that the US economy was on its way to serious deceleration and that this would bring down inflation with it. In the futures market, the fed funds rate was expected to peak just south of five percent.
In December, the Federal Reserve itself believed that it would stop at 500 basis points to 525 basis points. Then came the CPI (consumer price index) report for January – reported on February 14. It was hotter than expected. In the 12 months to January, headline and core CPI increased 6.4 percent and 5.6 percent, having respectively peaked last year at 9.1 percent in June and 6.6 percent in September. Ten days later, the PCE (personal consumption expenditures) surprised on the upside. In the 12 months to January, headline and core PCE grew 5.4 percent and 4.7 percent respectively; they respectively peaked last year in June and February at seven percent and 5.4 percent.
The Fed tends to focus on core PCE and has a two-percent objective on that metric.
January’s inflation picture changed futures traders’ rates outlook. Post-CPI, they had priced in a peak in the benchmark rates between 525 basis points and 550 basis points and expected a 25-basis-point cut in December. Post-PCE, the rates were still expected to peak between 525 basis points and 550 basis points, but no easing was expected this year. Then, for most of last week, the terminal rate was expected between 550 basis points and 575 basis points, with a cut in November; by the end of the week, expectations were lowered to 525 basis points and 550 basis points, with no cut this year (Chart 1). Phew! What a yo-yo!
The FOMC meets on 21-22 this month and a 25-basis-point hike is priced in. Although the Fed probably is not happy with January’s inflation readings, at this point it for sure would not want to go for a 50 having already done a 25 in February. A year ago, the fed funds rate was in a range of zero to 25 basis points. So, things have tightened quite a bit. Concurrently, the Fed is also shrinking its balance sheet, which is on its way to ending the year at around $7.3 trillion (Chart 1).
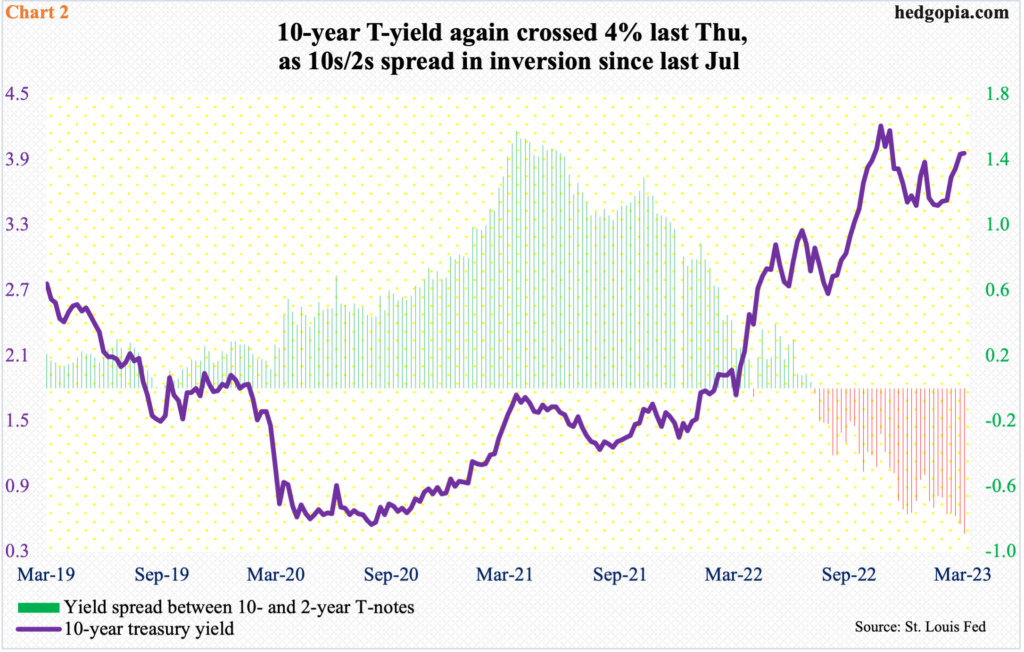
In keeping with the Fed-induced rising rates on the short end, the yield curve has shifted higher. The 10-year treasury yield rose from 1.68 percent early March last year to a high of 4.33 percent last October. Last week, the 10-year once again exceeded four percent, with Thursday ticking 4.09 percent. Although come Friday, it shed 11 basis points to close out the week at 3.96 percent.
Amidst this volatile action on the long end of the curve, the spread between 10- and two-year yields have inverted since last July (Chart 2). Markets are expecting a significant deceleration in economic activity at some point in the future. It is just a matter of when this would unfold. It is precisely because of this uncertainty fed funds futures traders have gone from pricing in a terminal rate of 475 basis points-500 basis points to 550 basis points-575 basis points to now 525 basis points-550 basis points.
The Fed is as confused. This month’s meeting is being watched with keen interest – the dot plot in particular. January’s CPI and PCE reports were anything but friendly to the central bank’s tightening outlook. This Friday, February’s jobs report will be reported; January’s was hotter than expected, with new 517,000 non-farm jobs and private-sector average hourly earnings growing 4.4 percent year-over-year.
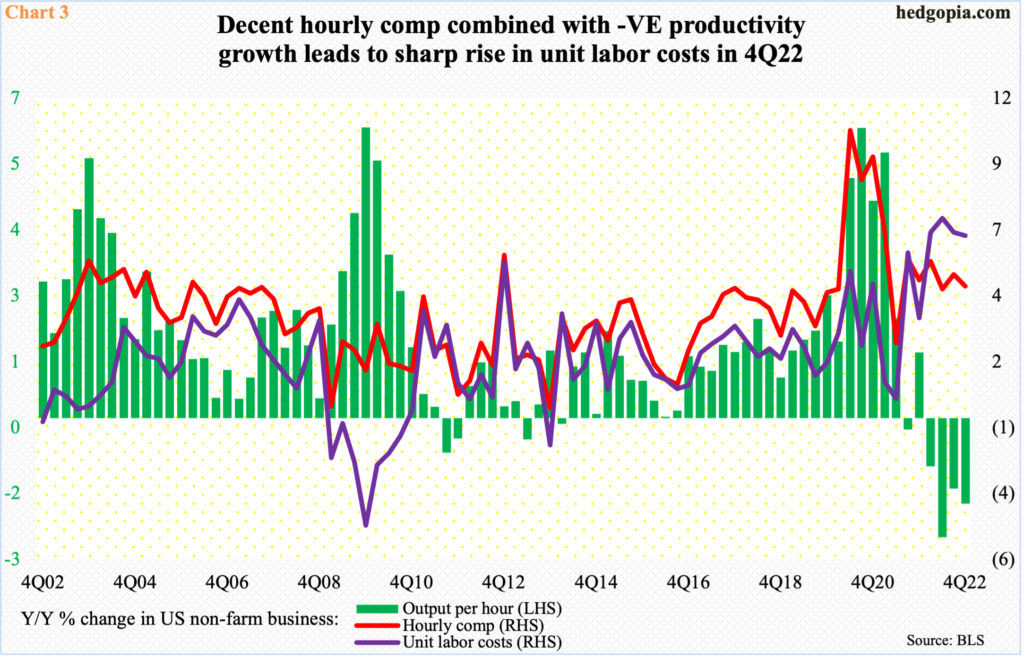
Last Thursday, a revised report of 4Q22 productivity was published. From a year ago, hourly compensation rose 4.4 percent, while output per hour shrank 1.8 percent. Unit labor costs as a result jumped 6.3 percent (Chart 3) – much, much faster than the Fed’s two-percent inflation objective.
From equity investors’ perspective, the initial selloff caused by the productivity report on Thursday was used as an opportunity to buy.
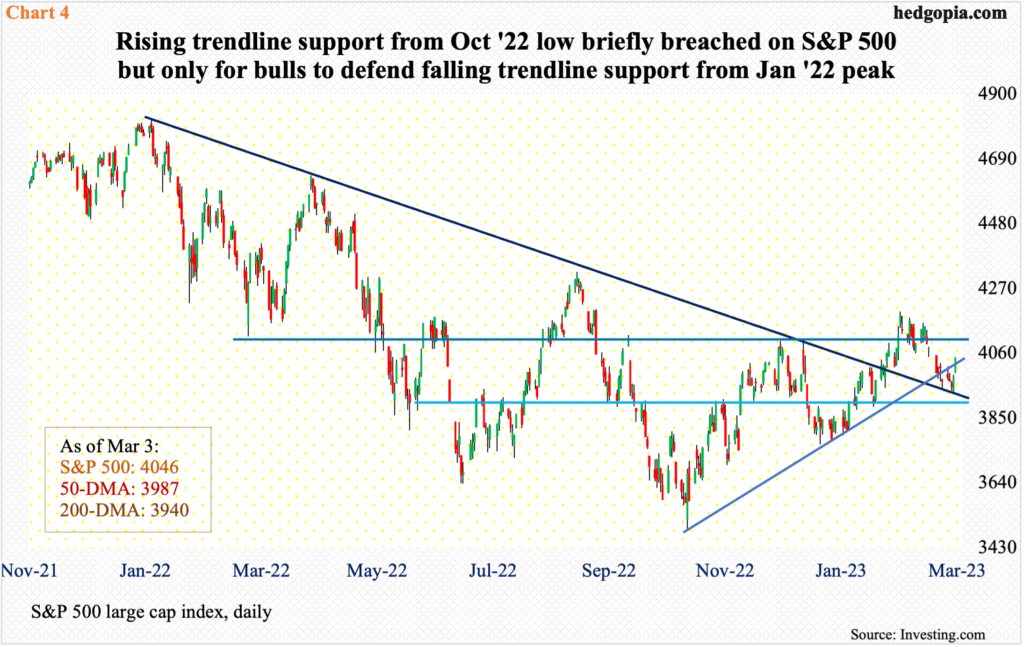
The S&P 500 reversed from down 0.6 percent intraday to close up 0.8 percent in that session; intraday, the 200-day (3940) was breached slightly but was saved on time. The large cap index has not lost the average on a closing basis since January 19. Come Friday, it shot up another 1.6 percent to 4046.
More gains are likely ahead.
With last Friday’s gains, the S&P 500 is back above a rising trend line from last October’s low (Chart 4) as well as the 50-day (3987). For several sessions, bulls consistently showed up at a falling trend line from the all-time high from January last year.
Immediately ahead, horizontal resistance lies at 4100, a takeout of which likely opens the door toward the February 2 high of 4195.
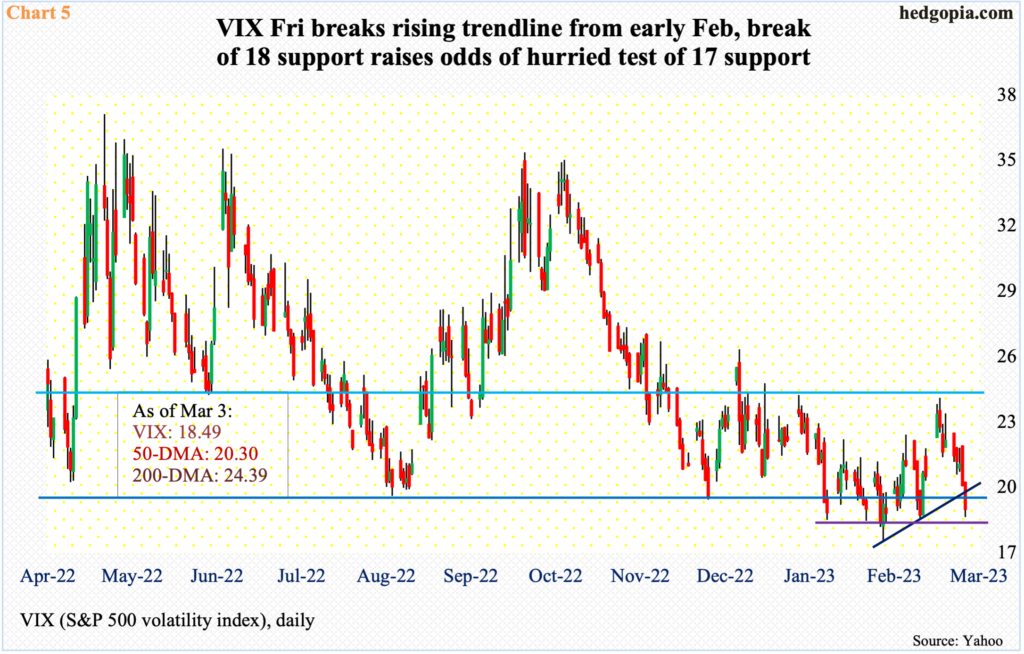
In this scenario, volatility needs to cooperate, and VIX very well might.
Last week, the weekly RSI turned back down from the median; VIX has not been above that line since last October. On a daily, a rising trend line from early February was broken last Friday (Chart 5).
As things stand, Friday’s intraday low of 18.16 (close of 18.49) was posted just above horizontal support at 18. Once this level gives way, the volatility index can proceed toward 17 in a hurry; on February 2, VIX made a low of 17.06, which was a 13-month low.
More By This Author:
Healthy Consumer Spending Owes To Covid Savings, Which Are Being Run OffStocks Sell Off Friday In Response To Stronger-Than-Expected PCE But Also Witness Dip-Buying
January Barometer Predicts Up Year, With Fed/Interest Rates/Inflation Caveat


