
Stocks Sell Off Friday In Response To Stronger-Than-Expected PCE But Also Witness Dip-Buying
Last Friday’s PCE report forced markets to reprice risk assets. Stocks dropped but at the same time closed significantly higher off sessions lows. Near-term, equities can rally – if nothing else just to unwind the daily oversold conditions.
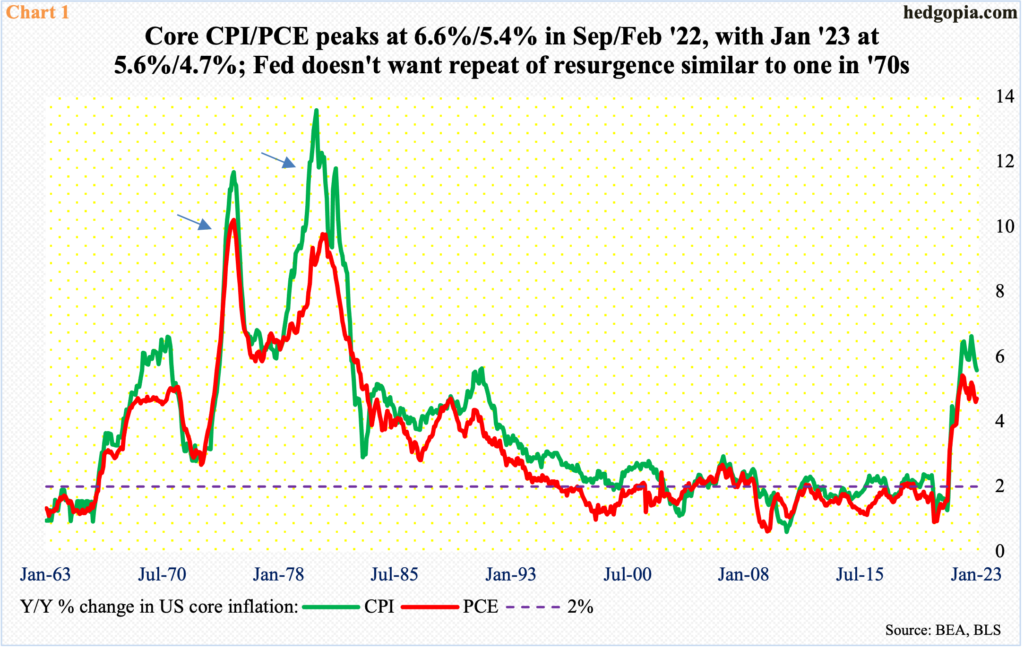
As the entire financial markets remain glued to data pertaining to particularly consumer inflation, last Friday’s PCE (personal consumption expenditures) surprised – on the upside. In the 12 months to January, headline and core PCE grew 5.4 percent and 4.7 percent respectively; this follows a 5.3- and 4.6-percent rise in December. January’s uptick thus ended a downward trend intact since last October. The two metrics respectively peaked last year in June and February at seven percent and 5.4 percent.
January’s PCE comes in the wake of a similar hotter-than-expected CPI report, which was published on the 14th (this month). In the 12 months to January, headline and core CPI increased 6.4 percent and 5.6 percent, having respectively peaked last year at 9.1 percent in June and 6.6 percent in September.
The Federal Reserve tends to focus on core PCE and has a two-percent objective on that metric. At the current 4.7 percent, it is obviously nowhere near that threshold. The central bank must be hoping January does not begin a reversal in the recent downward momentum in consumer inflation. It for sure does not want a repeat of the kind of resurgence witnessed in the ’70s (arrows in Chart 1).
Last Friday’s PCE forced markets to rejigger their inflation/interest rates outlook – albeit not on a major scale.
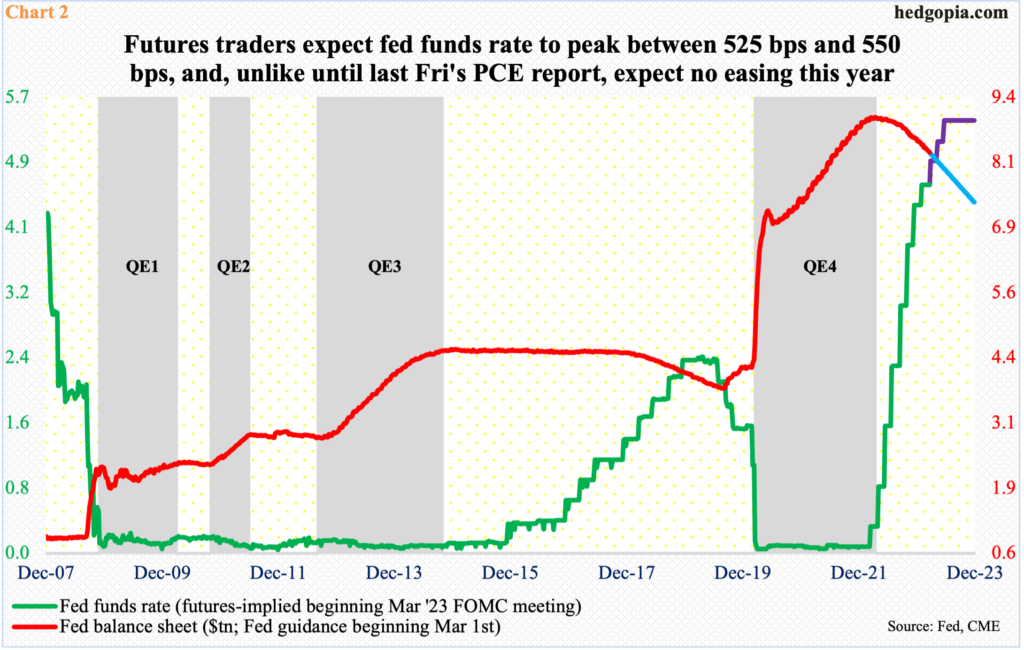
In the futures market, traders now do not expect the Fed to ease in December. Pre-PCE, they expected a 25-basis-point decrease.
Until January’s CPI, these traders not only expected the fed funds rate to peak south of five percent in the early months this year but also that by year-end the Fed would have cut twice in 25-basis-point increments. Post-CPI, they adjusted by pricing in a peak between 525 basis points and 550 basis points, although they continued to expect a 25-basis-point drop in December. After last Friday’s PCE, the benchmark rates are still expected to peak between 525 basis points and 550 basis points, but no easing is expected this year (Chart 2).
Last Friday, all kinds of assets got repriced. The 10-year treasury yield rose seven basis points to 3.95 percent. The US dollar index increased 0.6 percent to 105.16, which was the highest close since December 6. And risk assets took it on the chin.
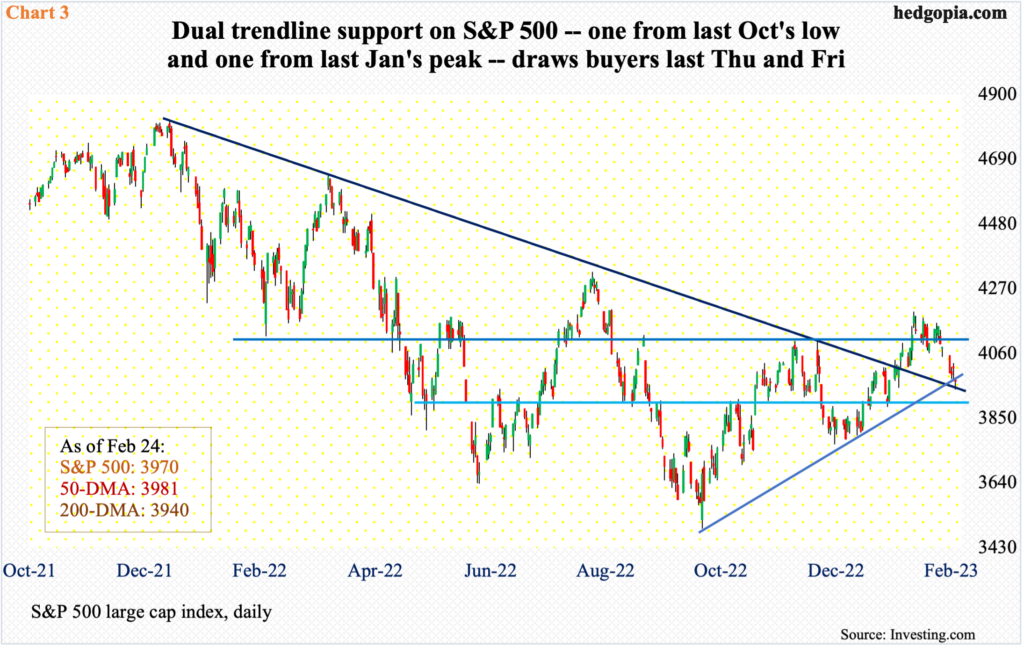
The S&P 500 dropped 1.1 percent to 3970, although the large cap index was down as much as 1.7 percent at the session low 3943. The weakness emanating from the inflation report was used as an opportunity to buy. This was also evident on Thursday.
The daily is oversold, and odds favor a rally in the near term. Medium- to long-term is another story, given the inflation/interest rates crosscurrents. The S&P 500 already jumped just north of 20 percent from last October’s low before retreating early this month.
Last Friday’s low just about kissed the 200-day (3940), forming a bullish hammer right on the average. A day earlier, the 50-day (3980) drew bids, once again forming a hammer; this was preceded by a spinning top on the average on Wednesday.
Further, the lows of last Thursday and Friday coincide with a rising trendline from last October’s low and a falling trendline from the January 2022 peak (Chart 3).
Nearest horizontal resistance lies at 4100.
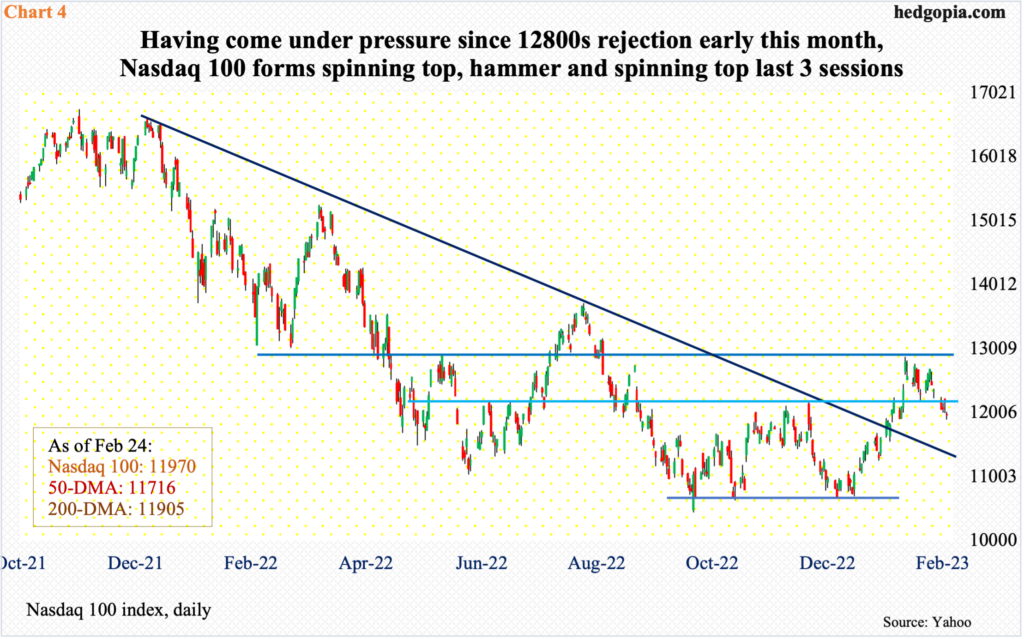
The near-term dynamics look similar on the Nasdaq 100 index. The tech-heavy index began to retreat after facing resistance at 12800s on the 2nd (this month). Earlier, it bottomed at 10441 last October.
Last Friday’s spinning top formed right on the 200-day (11905). This was preceded by a bullish hammer on Thursday and a spinning top on Wednesday.
As is the case with the S&P 500, the daily is oversold on the Nasdaq 100.
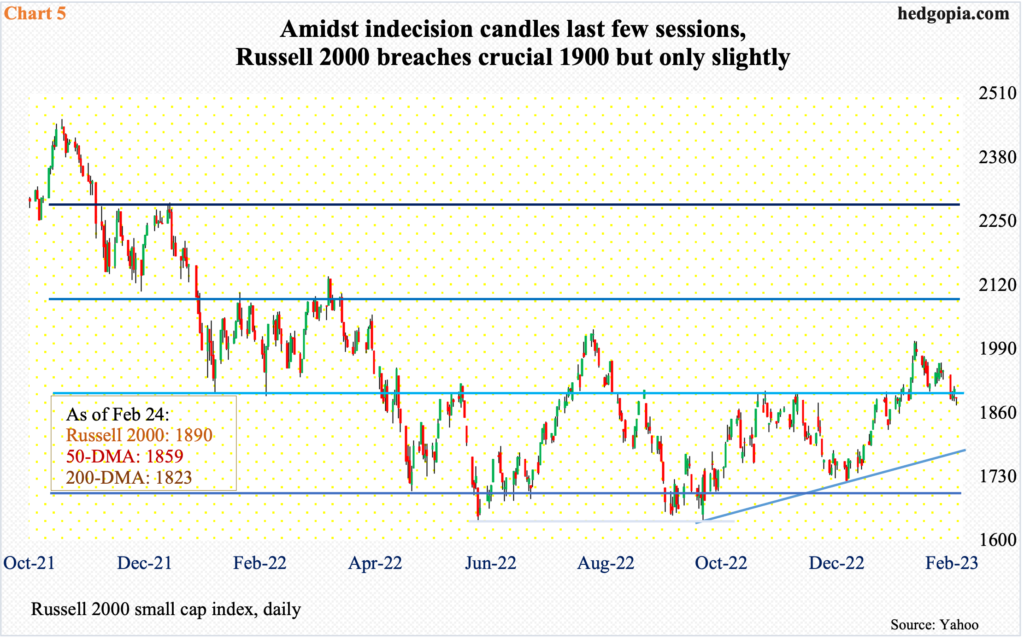
The Russell 2000 is no different.
The small cap index was caught in a 1700-1900 range for eight months. Late January, small-cap bulls succeeded in taking out the upper range, before proceeding to tag 2008 by the 2nd. In the weakness that followed, a bull-bear tug of war for control of 1900 took place for most of last week, in the end ending the week at 1890. This is a slight breach of the level, but nothing major (Chart 5).
The 50-day is just underneath at 1859. Worse, the average could be tested in the sessions ahead, but right here and now, it is unlikely it gives way decisively.
More By This Author:
January Barometer Predicts Up Year, With Fed/Interest Rates/Inflation Caveat
Fed Has No Choice But To Engineer Economic Contraction
CoT Report This Week: What Hedge Funds, Noncommercials Are Buying; Futures


