

Image Source: Pixabay
Here are the latest charts and statistics for the Commitment of Traders (COT) reports data published by the Commodities Futures Trading Commission (CFTC).
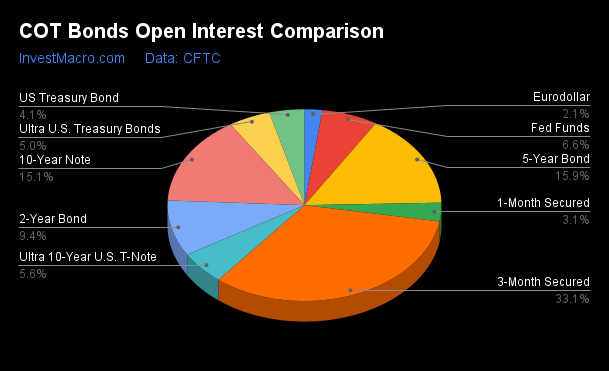
The latest COT data is updated through Tuesday, April 25, and it shows a quick view of how large traders (for-profit speculators and commercial hedgers) were positioned in the futures markets.
Weekly Speculator Changes Led by Fed Funds & 2-Year Bonds
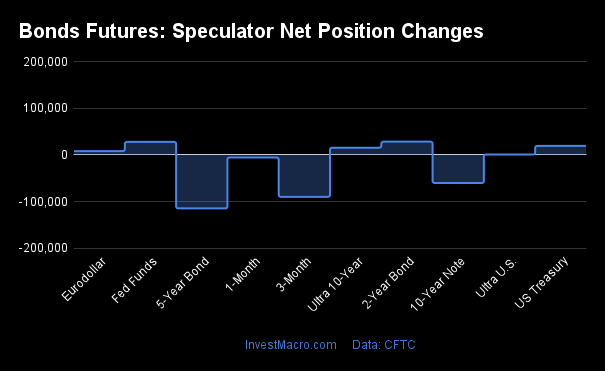
The COT bond market speculator bets were higher this week, as six out of the nine bond markets we cover had higher positioning while the other three markets had lower speculator contracts.
Leading the gains was the 2-year bond (28,607 contracts), with Fed Funds (28,111 contracts), US Treasury Bonds (19,560 contracts), Ultra 10-year bonds (15,667 contracts), the Eurodollar (8,395 contracts), and Ultra Treasury bonds (1,016 contracts) also experiencing a positive week.
The bond markets with declines in speculator bets for the week were 5-year bonds (-114,786 contracts), SOFR 3-month bonds (-89,967 contracts), and 10-year bonds (-60,180 contracts).
Speculators Push Their 5-Year Bond Bets to Most Bearish On Record
Highlighting the COT bond’s data this week is the historic weakness in 5-year bonds speculator net contracts. Large speculative 5-year bond positions dropped sharply this week by over -114,000 net contracts, marking the largest decline in 20 weeks, marking a decrease through four of the past six weeks.
The 5-year net positions have fallen by a total of -312,076 contracts over the past six-week period, going from a total of -557,212 contracts on March 14 to a total net position of -869,288 contracts this week.
This bearishness has pushed the net position to the most bearish level in history, according to CFTC data that goes back to 1988. The previous record bearish position was a total of -867,556 contracts that took place on Aug. 7 of 2018 and coincided with an almost exact bottom in the 5-year bond futures price (see image below comparing the price on dates of record bearish levels).
The 5-year bond futures price has not followed along lately with the extreme bearishness of the speculators in this case, and it has potentially already bottomed with a low of 105.14 in October and a more recent dip to 106.02 in March. The 5-year futures closed this week higher near the 109.24 level and about 3.25% higher than the most recent low in March.
In terms of bond yields, the 5-year yield is currently trading at the 3.48% level, and it is also down from a recent high of 4.37% in March. Only time will tell if the 5-year bond price has bottomed (and yields have topped out), with the future path of the US Federal Reserve and the US economy likely weighing heavily on the future direction.
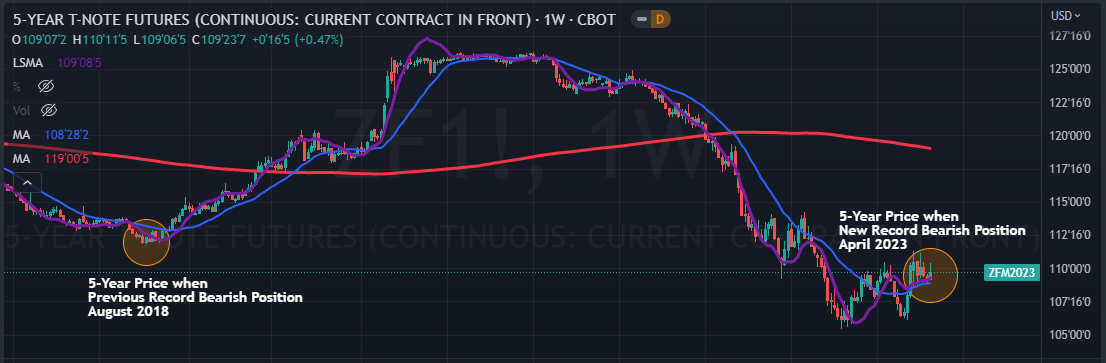
Chart by TradingView
Data Snapshot of Bond Market Traders | Columns Legend
|
Apr-25-2023
|
OI
|
OI-Index
|
Spec-Net
|
Spec-Index
|
Com-Net
|
COM-Index
|
Smalls-Net
|
Smalls-Index
|
|---|---|---|---|---|---|---|---|---|
| 5-Year | 4,576,091 | 100 | -869,288 | 0 | 837,209 | 100 | 32,079 | 90 |
| 10-Year | 4,362,222 | 90 | -740,261 | 0 | 685,216 | 95 | 55,045 | 97 |
| 2-Year | 2,719,441 | 85 | -546,307 | 19 | 486,757 | 76 | 59,550 | 84 |
| FedFunds | 1,909,067 | 81 | -90,608 | 28 | 103,006 | 72 | -12,398 | 67 |
| Long T-Bond | 1,193,358 | 55 | -97,368 | 53 | 26,698 | 20 | 70,670 | 100 |
| Eurodollar | 604,722 | 0 | -42,836 | 73 | 52,682 | 23 | -9,846 | 97 |
Strength Scores Led by Eurodollar & US Treasury Bonds
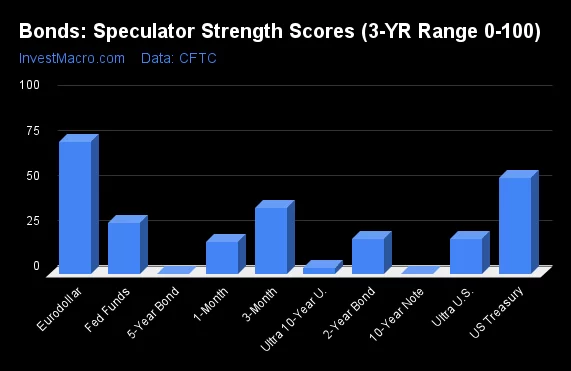
COT Strength Scores (which are a normalized measure of speculator positions over a three-year range, from 0 to 100, where above 80 is Extreme-Bullish and below 20 is Extreme-Bearish) showed that the Eurodollar (73%) and US Treasury Bonds (53%) lead the bond markets this week. The SOFR 3-months bond (36%) came in as the next highest in the weekly strength scores.
On the downside, 5-year bonds (0%), 10-year bonds (0%), Ultra 10-year bonds (3%), and 2-year bonds (19%) followed behind with the lowest strength levels, and they are in Extreme-Bearish territory (below 20%).
Strength statistics:
- Fed Funds (28.4%) vs. Fed Funds the previous week (25.0%)
- 2-year bond (19.2%) vs. 2-year bond the previous week (15.5%)
- 5-year bond (0.0%) vs. 5-year bond the previous week (11.9%)
- 10-year bond (0.0%) vs. 10-year bond the previous week (6.5%)
- Ultra 10-year bond (3.3%) vs. Ultra 10-year Bond the previous week (0.0%)
- US Treasury bond (52.9%) vs. US Treasury bond the previous week (46.5%)
- Ultra US Treasury bond (19.6%) vs. Ultra US Treasury bond the previous week (19.1%)
- Eurodollar (72.9%) vs. Eurodollar the previous week (72.7%)
- SOFR 3-months (36.5%) vs. SOFR 3-months the previous week (43.8%)
Ultra Treasury Bonds & US Treasury Bonds Top the Six-Week Strength Trends
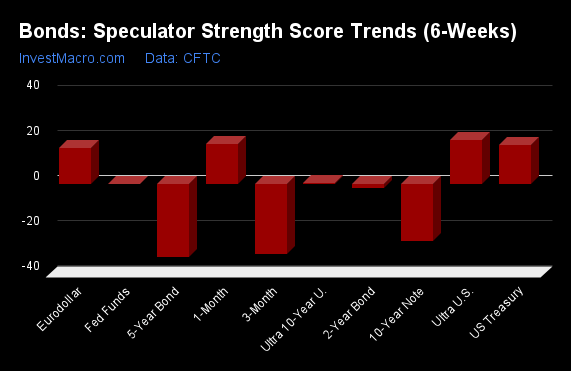
COT Strength Score Trends (or otherwise called the move index, which calculates the six-week changes in strength scores) showed that Ultra Treasury bonds (19%) and US Treasury bonds (17%) were the leaders of bonds in terms of their six-week trend scores.
The 5-year bond (-32.3%) led the downside, with SOFR 3-month bonds (-31%) and 10-year bonds (-25%) following behind with the next lowest in terms of trend scores.
Strength trend statistics:
- Fed Funds (-0.2%) vs. Fed Funds the previous week (15.2%)
- 2-year bond (-1.9%) vs. 2-year bond the previous week (5.5%)
- 5-year bond (-32.3%) vs. 5-year bond the previous week (-10.2%)
- 10-year bond (-25.3%) vs. 10-year bond the previous week (-13.5%)
- Ultra 10-year bond (0.3%) vs. Ultra 10-year bond the previous week (-3.0%)
- US Treasury bond (17.1%) vs. US Treasury bond the previous week (18.3%)
- Ultra US Treasury bond (19.4%) vs. Ultra US Treasury bond the previous week (11.3%)
- Eurodollar (15.9%) vs. Eurodollar the previous week (23.1%)
- SOFR 3-months (-31.3%) vs. SOFR 3-months the previous week (43.8%)
Individual Bond Markets - 3-Month Eurodollars Futures
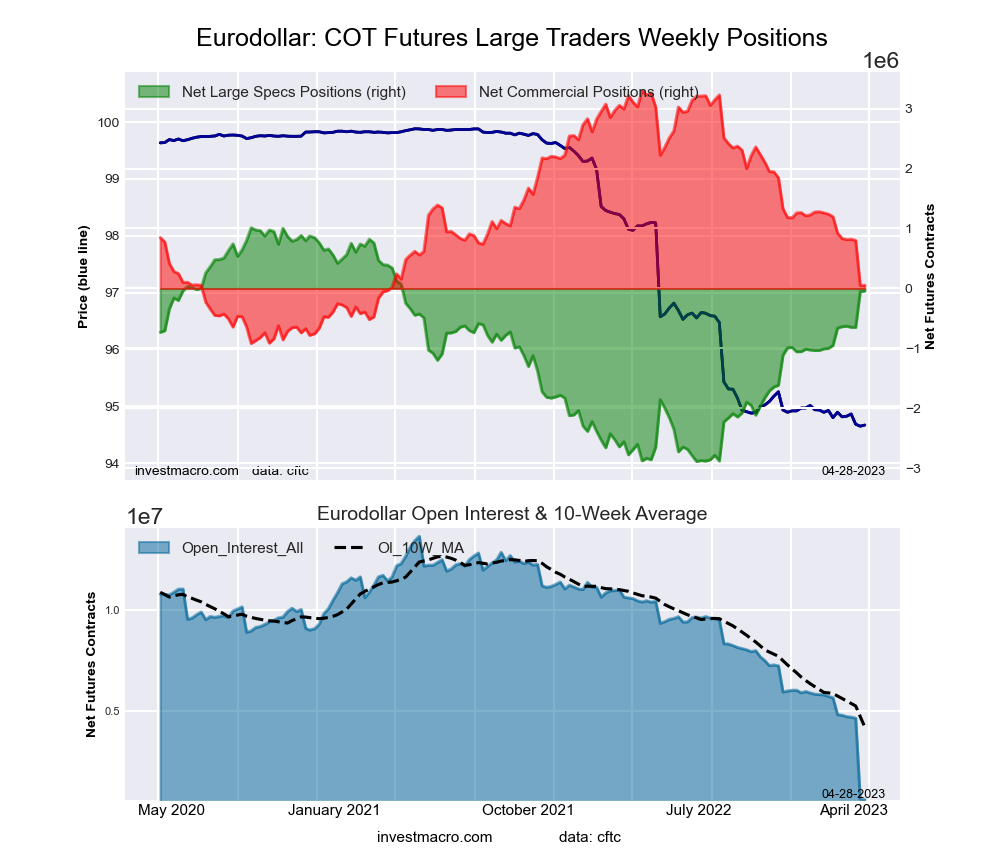
The 3-month Eurodollars large speculator standing this week was a net position of -42,836 contracts in the data reported through Tuesday. This was a weekly lift of 8,395 contracts from the previous week, which had a total of -51,231 net contracts.
This week’s current strength score (the trader positioning range over the past three years, measured from 0 to 100) shows the speculators are currently Bullish with a score of 72.9%. The commercials are Bearish with a score of 23.0%, and the small traders (not shown in chart) are Bullish-Extreme with a score of 97.2%.
| 3-Month Eurodollars Statistics | SPECULATORS | COMMERCIALS | SMALL TRADERS |
| –% of Open Interest Longs: | 26.8 | 62.2 | 9.5 |
| –% of Open Interest Shorts: | 33.9 | 53.5 | 11.2 |
| – Net Position: | -42,836 | 52,682 | -9,846 |
| – Gross Longs: | 162,210 | 375,924 | 57,705 |
| – Gross Shorts: | 205,046 | 323,242 | 67,551 |
| – Long to Short Ratio: | 0.8 to 1 | 1.2 to 1 | 0.9 to 1 |
| NET POSITION TREND: | |||
| – Strength Index Score (3 Year Range Pct): | 72.9 | 23.0 | 97.2 |
| – Strength Index Reading (3 Year Range): | Bullish | Bearish | Bullish-Extreme |
| NET POSITION MOVEMENT INDEX: | |||
| – 6-Week Change in Strength Index: | 15.9 | -20.7 | 52.8 |
Secured Overnight Financing Rate (3-Month) Futures
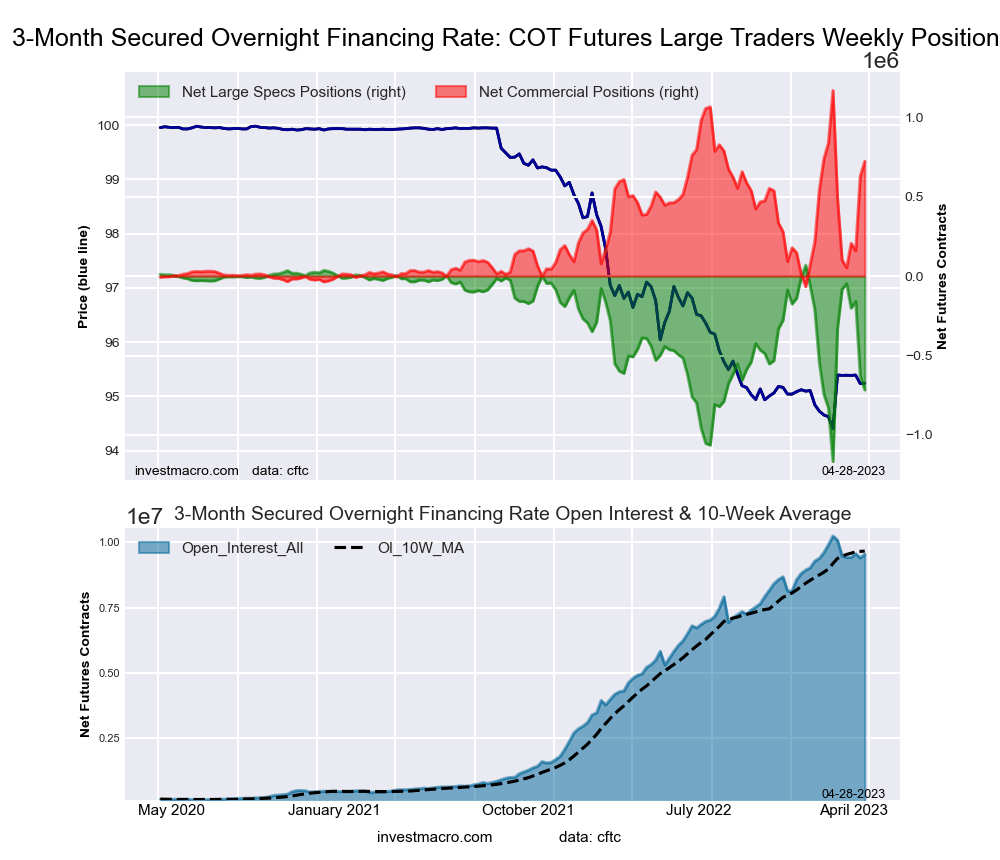
The Secured Overnight Financing Rate (3-month) large speculator standing this week was a net position of -716,355 contracts in the data reported through Tuesday. This was a weekly decrease of -89,967 contracts from the previous week, which had a total of -626,388 net contracts.
This week’s current strength score shows the speculators are currently Bearish with a score of 36.5%. The commercials are Bullish with a score of 63.9%, and the small traders are Bullish-Extreme with a score of 84.5%.
| SOFR 3-Months Statistics | SPECULATORS | COMMERCIALS | SMALL TRADERS |
| –% of Open Interest Longs: | 14.2 | 64.0 | 0.4 |
| –% of Open Interest Shorts: | 21.7 | 56.4 | 0.5 |
| – Net Position: | -716,355 | 722,508 | -6,153 |
| – Gross Longs: | 1,351,648 | 6,105,246 | 41,555 |
| – Gross Shorts: | 2,068,003 | 5,382,738 | 47,708 |
| – Long to Short Ratio: | 0.7 to 1 | 1.1 to 1 | 0.9 to 1 |
| NET POSITION TREND: | |||
| – Strength Index Score (3 Year Range Pct): | 36.5 | 63.9 | 84.5 |
| – Strength Index Reading (3 Year Range): | Bearish | Bullish | Bullish-Extreme |
| NET POSITION MOVEMENT INDEX: | |||
| – 6-Week Change in Strength Index: | -31.3 | 18.9 | 84.5 |
30-Day Federal Funds Futures
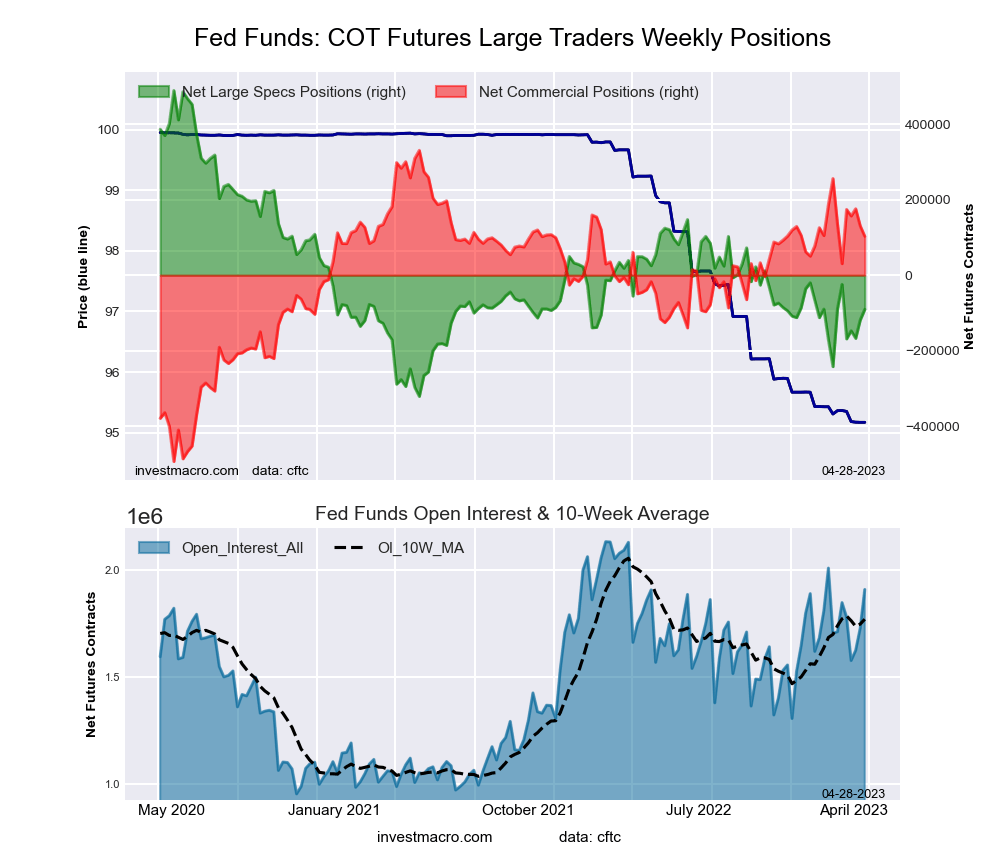
The 30-day Federal Funds large speculator standing this week was a net position of -90,608 contracts in the data reported through Tuesday. This was a weekly boost of 28,111 contracts from the previous week, which had a total of -118,719 net contracts.
This week’s current strength score shows the speculators are currently Bearish with a score of 28.4%. The commercials are Bullish with a score of 72.4%, and the small traders are Bullish with a score of 66.7%.
| 30-Day Federal Funds Statistics | SPECULATORS | COMMERCIALS | SMALL TRADERS |
| –% of Open Interest Longs: | 3.7 | 79.7 | 2.2 |
| –% of Open Interest Shorts: | 8.4 | 74.3 | 2.8 |
| – Net Position: | -90,608 | 103,006 | -12,398 |
| – Gross Longs: | 70,441 | 1,520,816 | 41,850 |
| – Gross Shorts: | 161,049 | 1,417,810 | 54,248 |
| – Long to Short Ratio: | 0.4 to 1 | 1.1 to 1 | 0.8 to 1 |
| NET POSITION TREND: | |||
| – Strength Index Score (3 Year Range Pct): | 28.4 | 72.4 | 66.7 |
| – Strength Index Reading (3 Year Range): | Bearish | Bullish | Bullish |
| NET POSITION MOVEMENT INDEX: | |||
| – 6-Week Change in Strength Index: | -0.2 | -3.9 | 66.7 |
2-Year Treasury Note Futures
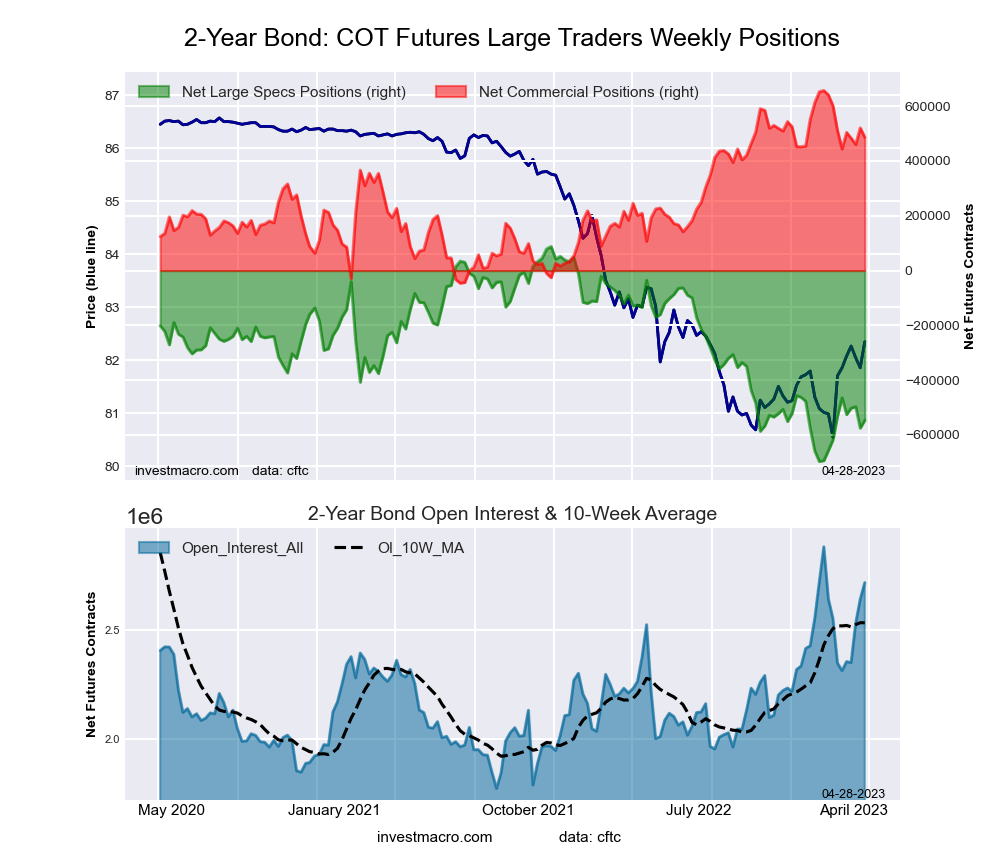
The 2-year Treasury note large speculator standing this week was a net position of -546,307 contracts in the data reported through Tuesday. This was a weekly increase of 28,607 contracts from the previous week, which had a total of -574,914 net contracts.
This week’s current strength score shows the speculators are currently Bearish-Extreme with a score of 19.2%. The commercials are Bullish with a score of 75.8%, and the small traders are Bullish-Extreme with a score of 84.3%.
| 2-Year Treasury Note Statistics | SPECULATORS | COMMERCIALS | SMALL TRADERS |
| –% of Open Interest Longs: | 9.8 | 81.0 | 8.2 |
| –% of Open Interest Shorts: | 29.9 | 63.1 | 6.0 |
| – Net Position: | -546,307 | 486,757 | 59,550 |
| – Gross Longs: | 265,711 | 2,203,465 | 221,675 |
| – Gross Shorts: | 812,018 | 1,716,708 | 162,125 |
| – Long to Short Ratio: | 0.3 to 1 | 1.3 to 1 | 1.4 to 1 |
| NET POSITION TREND: | |||
| – Strength Index Score (3 Year Range Pct): | 19.2 | 75.8 | 84.3 |
| – Strength Index Reading (3 Year Range): | Bearish-Extreme | Bullish | Bullish-Extreme |
| NET POSITION MOVEMENT INDEX: | |||
| – 6-Week Change in Strength Index: | -1.9 | -3.4 | 18.5 |
5-Year Treasury Note Futures
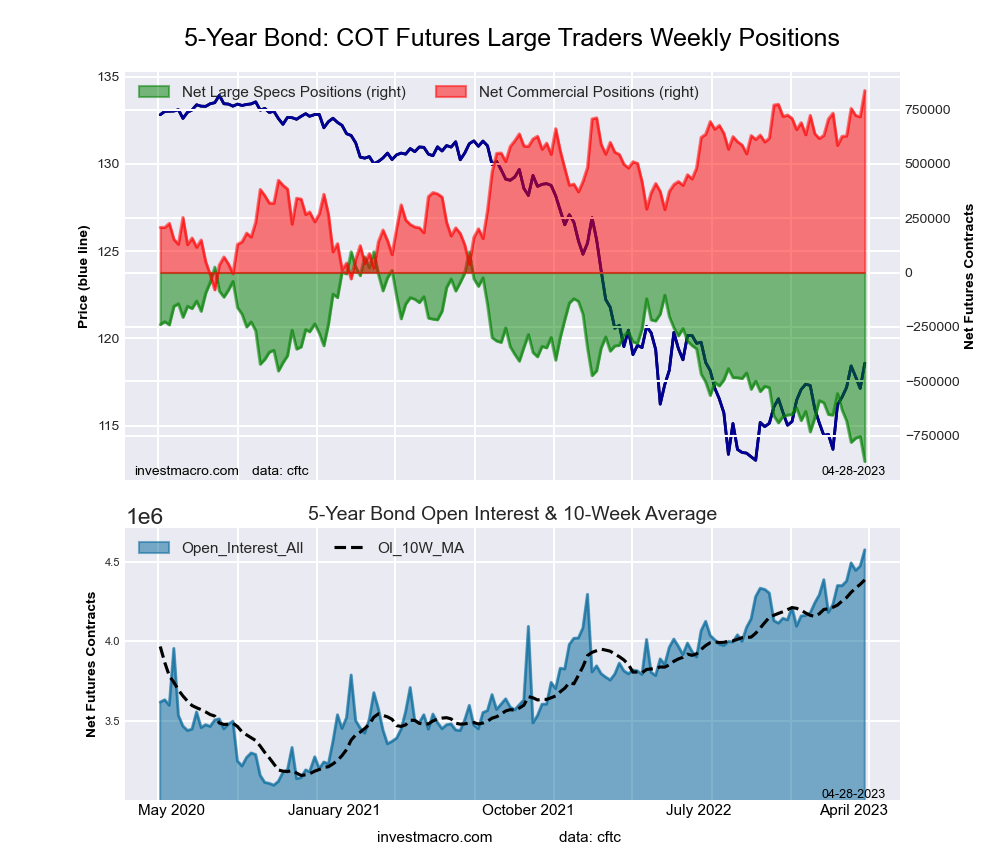
The 5-year Treasury note large speculator standing this week was a net position of -869,288 contracts in the data reported through Tuesday. This was a weekly decline of -114,786 contracts from the previous week, which had a total of -754,502 net contracts.
This week’s current strength score shows the speculators are currently Bearish-Extreme with a score of 0.0%. The commercials are Bullish-Extreme with a score of 100.0%, and the small traders are Bullish-Extreme with a score of 89.8%.
| 5-Year Treasury Note Statistics | SPECULATORS | COMMERCIALS | SMALL TRADERS |
| –% of Open Interest Longs: | 6.7 | 84.1 | 7.9 |
| –% of Open Interest Shorts: | 25.7 | 65.8 | 7.2 |
| – Net Position: | -869,288 | 837,209 | 32,079 |
| – Gross Longs: | 307,640 | 3,846,432 | 359,672 |
| – Gross Shorts: | 1,176,928 | 3,009,223 | 327,593 |
| – Long to Short Ratio: | 0.3 to 1 | 1.3 to 1 | 1.1 to 1 |
| NET POSITION TREND: | |||
| – Strength Index Score (3 Year Range Pct): | 0.0 | 100.0 | 89.8 |
| – Strength Index Reading (3 Year Range): | Bearish-Extreme | Bullish-Extreme | Bullish-Extreme |
| NET POSITION MOVEMENT INDEX: | |||
| – 6-Week Change in Strength Index: | -32.3 | 27.5 | 16.4 |
10-Year Treasury Note Futures
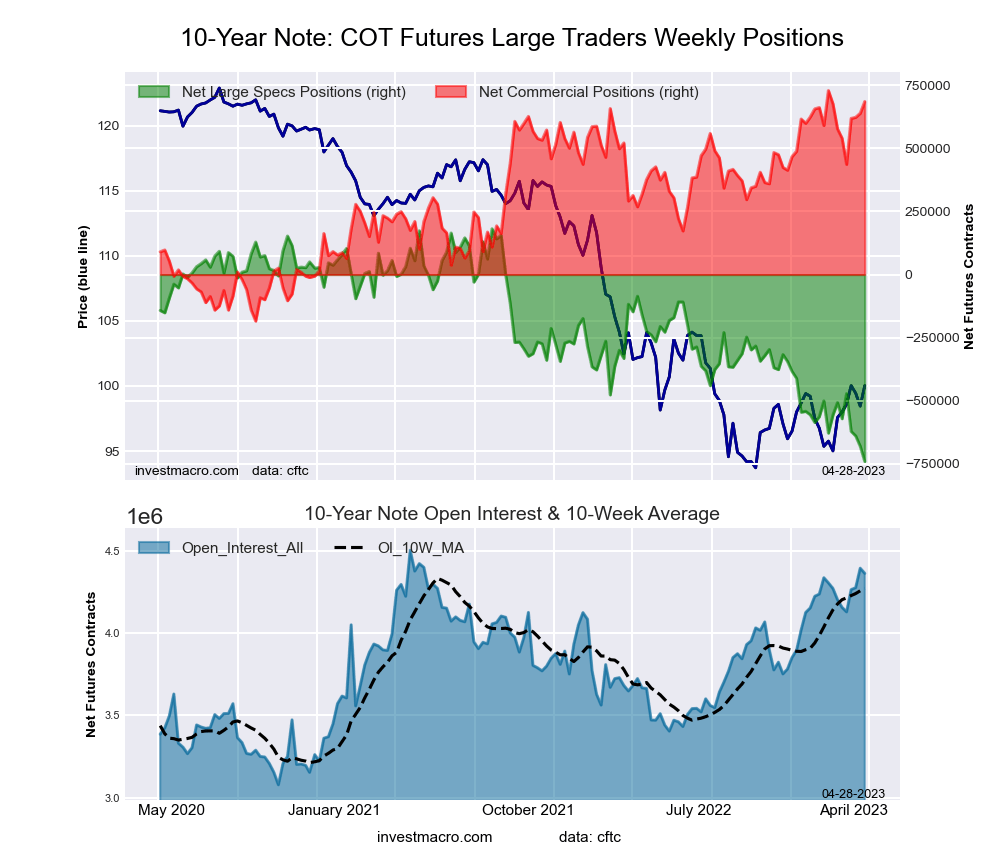
The 10-year Treasury note large speculator standing this week was a net position of -740,261 contracts in the data reported through Tuesday. This was a weekly decline of -60,180 contracts from the previous week, which had a total of -680,081 net contracts.
This week’s current strength score shows the speculators are currently Bearish-Extreme with a score of 0.0%. The commercials are Bullish-Extreme with a score of 95.2%, and the small traders are Bullish-Extreme with a score of 96.9%.
| 10-Year Treasury Note Statistics | SPECULATORS | COMMERCIALS | SMALL TRADERS |
| –% of Open Interest Longs: | 8.9 | 79.4 | 9.2 |
| –% of Open Interest Shorts: | 25.9 | 63.7 | 7.9 |
| – Net Position: | -740,261 | 685,216 | 55,045 |
| – Gross Longs: | 389,728 | 3,462,741 | 400,768 |
| – Gross Shorts: | 1,129,989 | 2,777,525 | 345,723 |
| – Long to Short Ratio: | 0.3 to 1 | 1.2 to 1 | 1.2 to 1 |
| NET POSITION TREND: | |||
| – Strength Index Score (3 Year Range Pct): | 0.0 | 95.2 | 96.9 |
| – Strength Index Reading (3 Year Range): | Bearish-Extreme | Bullish-Extreme | Bullish-Extreme |
| NET POSITION MOVEMENT INDEX: | |||
| – 6-Week Change in Strength Index: | -25.3 | 11.8 | 30.8 |
Ultra 10-Year Notes Futures
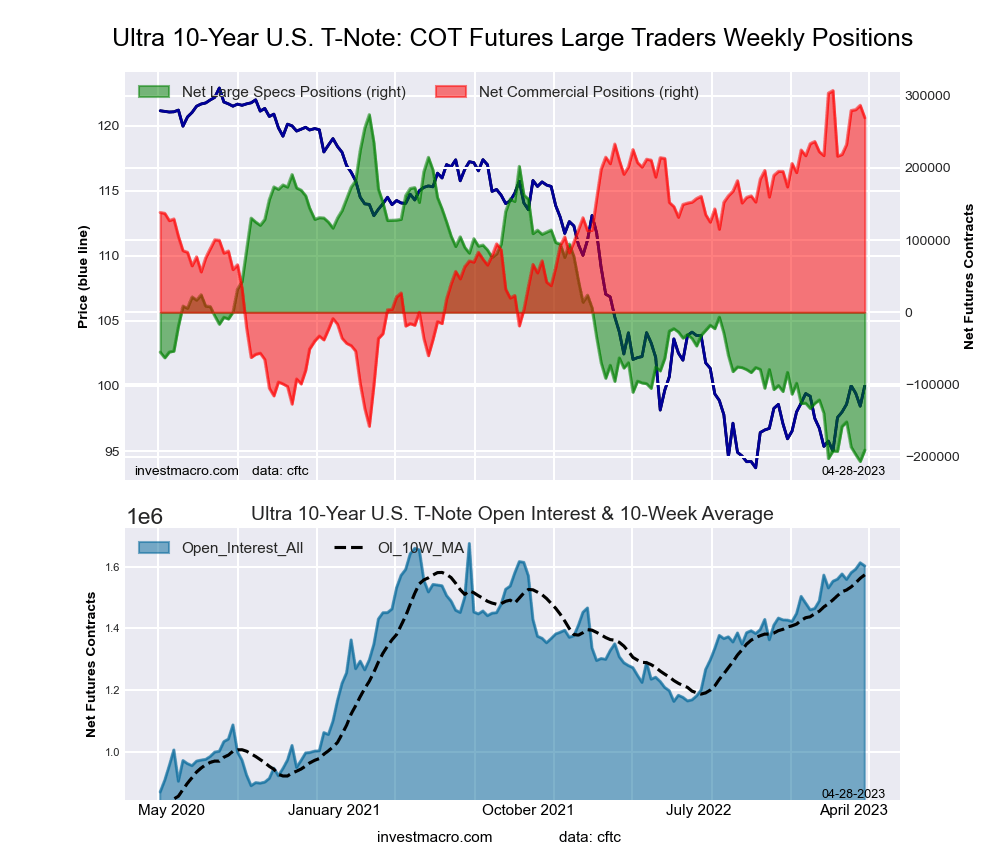
The Ultra 10-year notes large speculator standing this week was a net position of -190,916 contracts in the data reported through Tuesday. This was a weekly advance of 15,667 contracts from the previous week, which had a total of -206,583 net contracts.
This week’s current strength score shows the speculators are currently Bearish-Extreme with a score of 3.3%. The commercials are Bullish-Extreme with a score of 91.9%, and the small traders are Bullish with a score of 67.4%.
| Ultra 10-Year Notes Statistics | SPECULATORS | COMMERCIALS | SMALL TRADERS |
| –% of Open Interest Longs: | 8.6 | 80.0 | 10.0 |
| –% of Open Interest Shorts: | 20.5 | 63.2 | 14.9 |
| – Net Position: | -190,916 | 269,304 | -78,388 |
| – Gross Longs: | 137,531 | 1,281,853 | 160,380 |
| – Gross Shorts: | 328,447 | 1,012,549 | 238,768 |
| – Long to Short Ratio: | 0.4 to 1 | 1.3 to 1 | 0.7 to 1 |
| NET POSITION TREND: | |||
| – Strength Index Score (3 Year Range Pct): | 3.3 | 91.9 | 67.4 |
| – Strength Index Reading (3 Year Range): | Bearish-Extreme | Bullish-Extreme | Bullish |
| NET POSITION MOVEMENT INDEX: | |||
| – 6-Week Change in Strength Index: | 0.3 | 11.5 | -32.6 |
US Treasury Bonds Futures
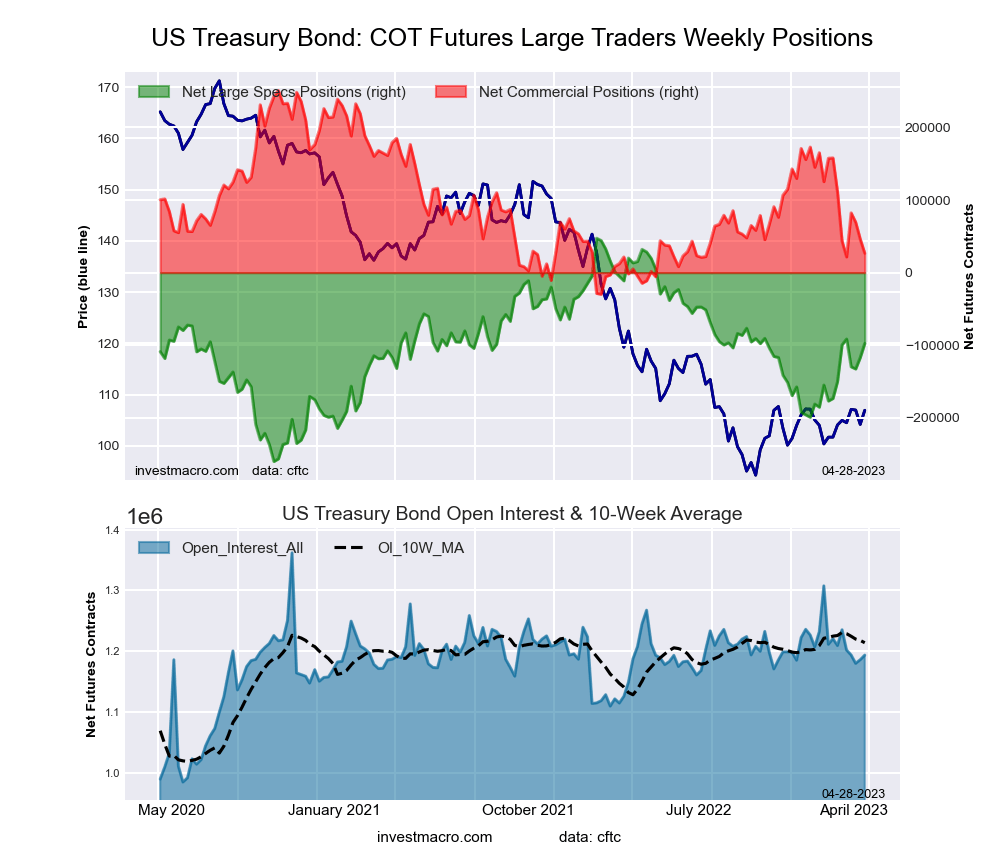
The US Treasury bonds large speculator standing this week was a net position of -97,368 contracts in the data reported through Tuesday. This was a weekly advance of 19,560 contracts from the previous week, which had a total of -116,928 net contracts.
This week’s current strength score shows the speculators are currently Bullish with a score of 52.9%. The commercials are Bearish with a score of 20.1%, and the small traders are Bullish-Extreme with a score of 100.0%.
| US Treasury Bonds Statistics | SPECULATORS | COMMERCIALS | SMALL TRADERS |
| –% of Open Interest Longs: | 6.8 | 77.9 | 14.8 |
| –% of Open Interest Shorts: | 15.0 | 75.7 | 8.8 |
| – Net Position: | -97,368 | 26,698 | 70,670 |
| – Gross Longs: | 81,222 | 929,608 | 176,053 |
| – Gross Shorts: | 178,590 | 902,910 | 105,383 |
| – Long to Short Ratio: | 0.5 to 1 | 1.0 to 1 | 1.7 to 1 |
| NET POSITION TREND: | |||
| – Strength Index Score (3 Year Range Pct): | 52.9 | 20.1 | 100.0 |
| – Strength Index Reading (3 Year Range): | Bullish | Bearish | Bullish-Extreme |
| NET POSITION MOVEMENT INDEX: | |||
| – 6-Week Change in Strength Index: | 17.1 | -30.1 | 23.2 |
Ultra US Treasury Bonds Futures
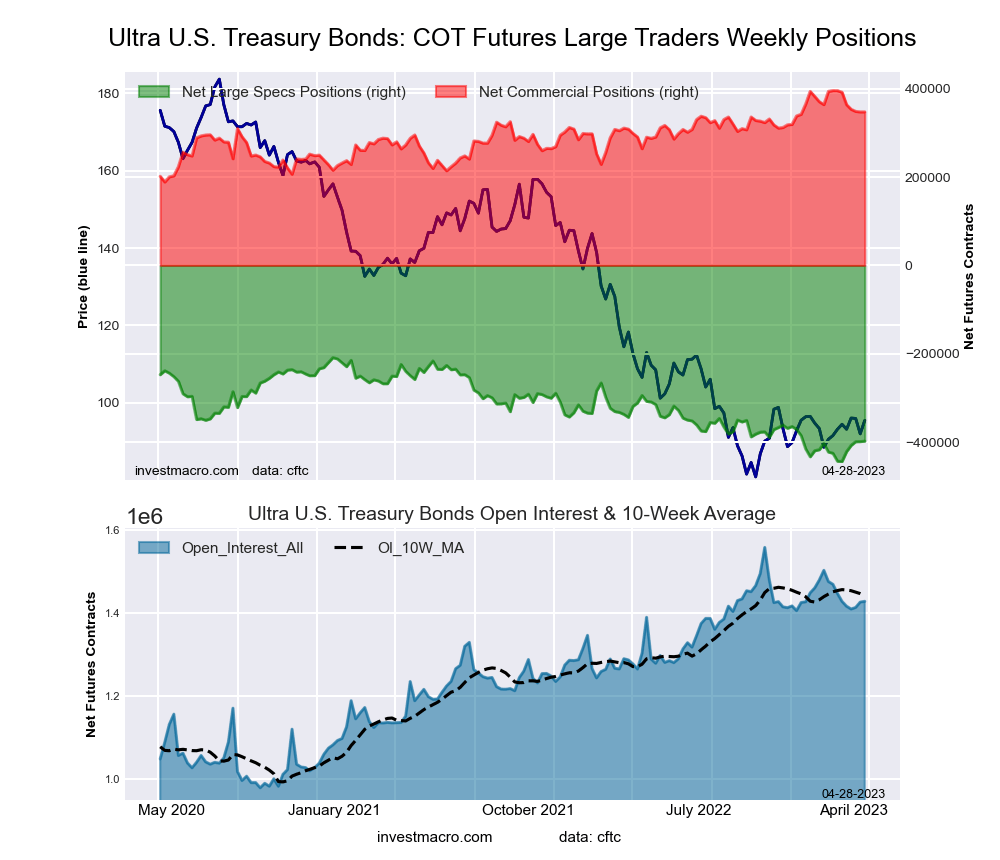
The Ultra US Treasury bonds large speculator standing this week was a net position of -397,985 contracts in the data reported through Tuesday. This was a weekly rise of 1,016 contracts from the previous week, which had a total of -399,001 net contracts.
This week’s current strength score shows the speculators are currently Bearish-Extreme with a score of 19.6%. The commercials are Bullish with a score of 76.7%, and the small traders are Bullish-Extreme with a score of 90.2%.
| Ultra US Treasury Bonds Statistics | SPECULATORS | COMMERCIALS | SMALL TRADERS |
| –% of Open Interest Longs: | 5.8 | 82.0 | 12.0 |
| –% of Open Interest Shorts: | 33.7 | 57.7 | 8.4 |
| – Net Position: | -397,985 | 347,575 | 50,410 |
| – Gross Longs: | 83,053 | 1,171,201 | 170,666 |
| – Gross Shorts: | 481,038 | 823,626 | 120,256 |
| – Long to Short Ratio: | 0.2 to 1 | 1.4 to 1 | 1.4 to 1 |
| NET POSITION TREND: | |||
| – Strength Index Score (3 Year Range Pct): | 19.6 | 76.7 | 90.2 |
| – Strength Index Reading (3 Year Range): | Bearish-Extreme | Bullish | Bullish-Extreme |
| NET POSITION MOVEMENT INDEX: | |||
| – 6-Week Change in Strength Index: | 19.4 | -23.2 | 2.5 |
Article By InvestMacro – Receive our weekly COT Newsletter
COT Report: The COT data, released weekly to the public each Friday, is updated through the most recent Tuesday (data is three days old), and it shows a quick view of how large speculators or non-commercials (for-profit traders) were positioned in the futures markets.
The CFTC categorizes trader positions according to commercial hedgers (traders who use futures contracts for hedging as part of the business), non-commercials (large traders who speculate to realize trading profits), and non-reportable traders (usually small traders/speculators), as well as their open interest (contracts open in the market at time of reporting). See CFTC criteria here.
More By This Author:
Currency Speculators Trim US Dollar Index Bets To Lowest Level In 93-Weeks
Soft Commodities Speculators Boost Sugar Bullish Bets For 4th Week To 84-Week High
Bonds Speculators Drop Their 10-Year Treasury Bets To A 237-Week Low


Comments
Log in or sign up to join the conversation.