
Here are the latest charts and statistics for the Commitment of Traders (COT) data published by the Commodities Futures Trading Commission (CFTC).
The latest COT data is updated through Tuesday August 9nd and shows a quick view of how large traders (for-profit speculators and commercial entities) were positioned in the futures markets.
Weekly Speculator Changes
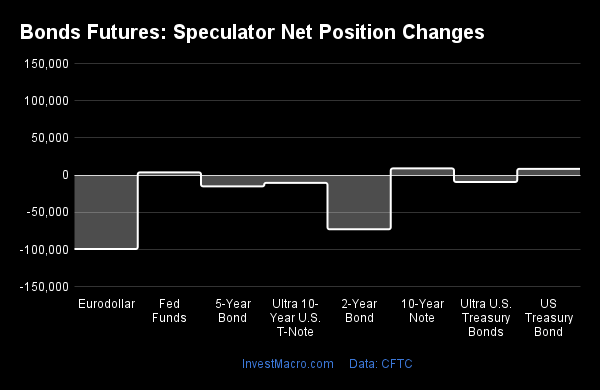
COT bond market speculator bets were overall lower this week as three out of the eight bond markets we cover had higher positioning this week while the other five markets had lower weekly contracts.
Leading the gains for the bond markets was the 10-Year Bond (9,012 contracts) with the Long US Bond (8,467 contracts) and the Fed Funds (3,686 contracts) also having positive weeks.
The bond markets leading the declines in speculator bets this week were the Eurodollar (-99,296 contracts) and the 2-Year Bond (-72,753 contracts) with the 5-Year Bond (-15,058 contracts), the Ultra 10-Year (-10,376 contracts) and the Ultra US Bond (-9,201 contracts) also registering lower bets for the week.
Data Snapshot of Bond Market Traders | Columns Legend
| Eurodollar | 9,633,698 | 16 | -2,885,979 | 0 | 3,205,927 | 98 | -319,948 | 34 |
| 5-Year | 3,901,253 | 46 | -351,003 | 22 | 481,266 | 72 | -130,263 | 45 |
| 10-Year | 3,541,744 | 33 | -286,478 | 29 | 386,245 | 68 | -99,767 | 56 |
| 2-Year | 2,122,099 | 15 | -172,221 | 47 | 224,202 | 69 | -51,981 | 27 |
| FedFunds | 1,595,759 | 49 | 961 | 40 | 11,299 | 61 | -12,260 | 29 |
| Long T-Bond | 1,160,709 | 37 | -47,586 | 69 | 23,404 | 19 | 24,182 | 72 |
Strength Scores
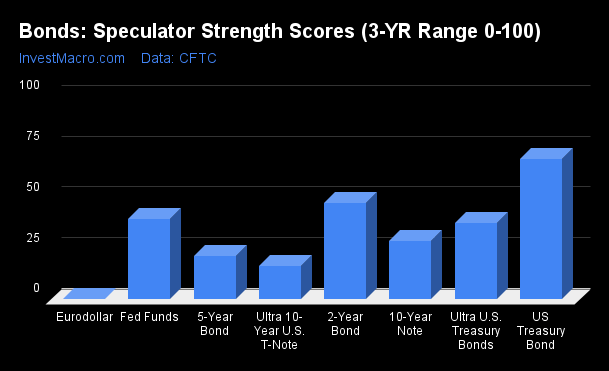
Strength Scores (a normalized measure of Speculator positions over a 3-Year range, from 0 to 100 where above 80 is extreme bullish and below 20 is extreme bearish) showed that the US Treasury Bond (69.1 percent) leads the bonds markets and is the only market with an above 50 percent score currently (above 50 percent of 3-year speculator bet range). The strength scores reiterate the weakness for speculator sentiment in bonds this year. On the downside, the Eurodollar (0.0 percent) comes in at the lowest strength level currently and is at the bottom of its three-year range. Joining the Eurodollar in an extreme bearish level (below 20 percent) is the Ultra 10-Year Bond at a 16.7 percent score.
Strength Statistics:
Fed Funds (39.7 percent) vs Fed Funds previous week (39.3 percent)
2-Year Bond (47.5 percent) vs 2-Year Bond previous week (62.2 percent)
5-Year Bond (21.6 percent) vs 5-Year Bond previous week (24.3 percent)
10-Year Bond (28.9 percent) vs 10-Year Bond previous week (27.5 percent)
Ultra 10-Year Bond (16.7 percent) vs Ultra 10-Year Bond previous week (19.4 percent)
US Treasury Bond (69.1 percent) vs US Treasury Bond previous week (66.3 percent)
Ultra US Treasury Bond (37.8 percent) vs Ultra US Treasury Bond previous week (41.6 percent)
Eurodollar (0.0 percent) vs Eurodollar previous week (1.8 percent)
Strength Trends
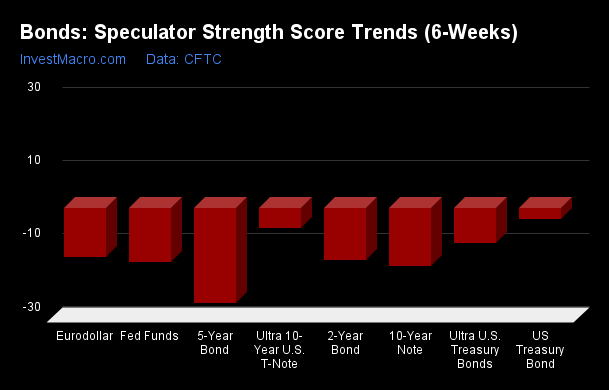
Strength Score Trends (or move index, calculates the 6-week changes in strength scores) show that there are no positive trends in the past six weeks currently. The US Treasury Bond (-3.0 percent), the Ultra 10-Year Bond (-5.4 percent) and the Ultra US Treasury Bond (-9.5 percent) are the markets showing the least declines in the latest trends data. The 5-Year Bond (-26.0 percent) leads the downside trend scores currently followed by the 10-Year Bond (-15.9 percent), the Fed Funds (-14.8 percent) and the 2-Year Bond (-14.2 percent).
Strength Trend Statistics:
Fed Funds (-14.8 percent) vs Fed Funds previous week (-15.7 percent)
2-Year Bond (-14.2 percent) vs 2-Year Bond previous week (4.0 percent)
5-Year Bond (-26.0 percent) vs 5-Year Bond previous week (-40.7 percent)
10-Year Bond (-15.9 percent) vs 10-Year Bond previous week (-10.2 percent)
Ultra 10-Year Bond (-5.4 percent) vs Ultra 10-Year Bond previous week (7.1 percent)
US Treasury Bond (-3.0 percent) vs US Treasury Bond previous week (-12.0 percent)
Ultra US Treasury Bond (-9.5 percent) vs Ultra US Treasury Bond previous week (-2.9 percent)
Eurodollar (-13.4 percent) vs Eurodollar (-14.5 percent)
Individual Markets:
3-Month Eurodollars Futures:
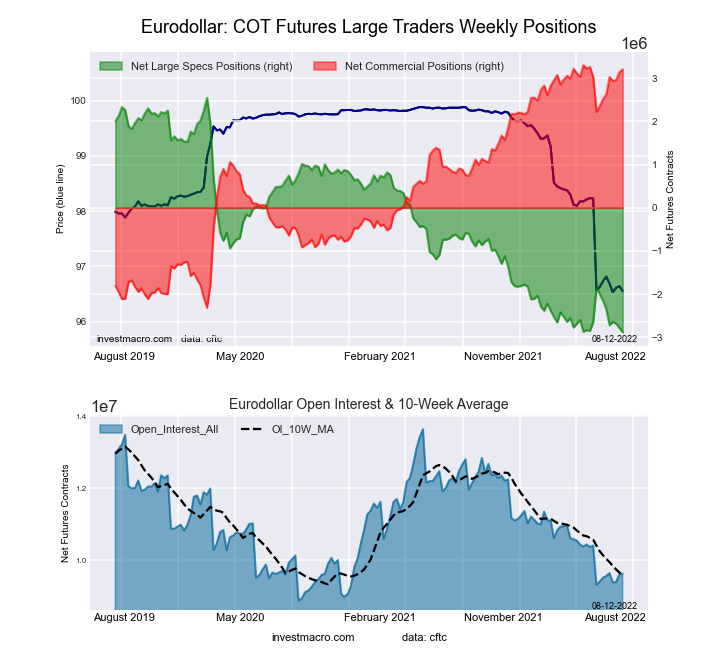
The 3-Month Eurodollars large speculator standing this week was a net position of -2,885,979 contracts in the data reported through Tuesday. This was a weekly decline of -99,296 contracts from the previous week which had a total of -2,786,683 net contracts.
This week’s current strength score (the trader positioning range over the past three years, measured from 0 to 100) shows the speculators are currently Bearish-Extreme with a score of 0.0 percent. The commercials are Bullish-Extreme with a score of 98.3 percent and the small traders (not shown in chart) are Bearish with a score of 34.0 percent.
| 3-Month Eurodollars Statistics | SPECULATORS | COMMERCIALS | SMALL TRADERS |
| – Percent of Open Interest Longs: | 4.6 | 71.2 | 4.8 |
| – Percent of Open Interest Shorts: | 34.6 | 37.9 | 8.1 |
| – Net Position: | -2,885,979 | 3,205,927 | -319,948 |
| – Gross Longs: | 447,560 | 6,859,412 | 463,734 |
| – Gross Shorts: | 3,333,539 | 3,653,485 | 783,682 |
| – Long to Short Ratio: | 0.1 to 1 | 1.9 to 1 | 0.6 to 1 |
| NET POSITION TREND: | |||
| – Strength Index Score (3 Year Range Pct): | 0.0 | 98.3 | 34.0 |
| – Strength Index Reading (3 Year Range): | Bearish-Extreme | Bullish-Extreme | Bearish |
| NET POSITION MOVEMENT INDEX: | |||
| – 6-Week Change in Strength Index: | -13.4 | 12.3 | 7.9 |
30-Day Federal Funds Futures:
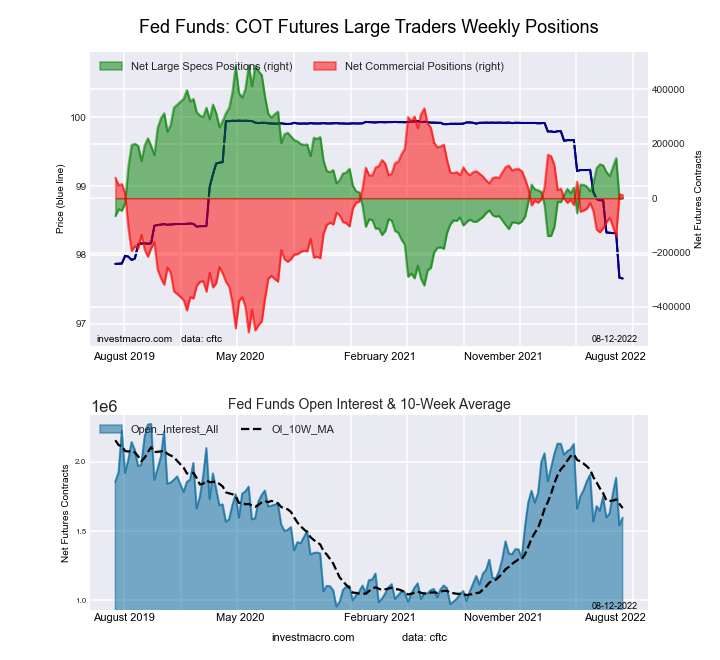
The 30-Day Federal Funds large speculator standing this week was a net position of 961 contracts in the data reported through Tuesday. This was a weekly gain of 3,686 contracts from the previous week which had a total of -2,725 net contracts.
This week’s current strength score (the trader positioning range over the past three years, measured from 0 to 100) shows the speculators are currently Bearish with a score of 39.7 percent. The commercials are Bullish with a score of 61.3 percent and the small traders (not shown in chart) are Bearish with a score of 28.5 percent.
| 30-Day Federal Funds Statistics | SPECULATORS | COMMERCIALS | SMALL TRADERS |
| – Percent of Open Interest Longs: | 10.8 | 74.5 | 2.1 |
| – Percent of Open Interest Shorts: | 10.8 | 73.8 | 2.9 |
| – Net Position: | 961 | 11,299 | -12,260 |
| – Gross Longs: | 172,597 | 1,188,928 | 33,947 |
| – Gross Shorts: | 171,636 | 1,177,629 | 46,207 |
| – Long to Short Ratio: | 1.0 to 1 | 1.0 to 1 | 0.7 to 1 |
| NET POSITION TREND: | |||
| – Strength Index Score (3 Year Range Pct): | 39.7 | 61.3 | 28.5 |
| – Strength Index Reading (3 Year Range): | Bearish | Bullish | Bearish |
| NET POSITION MOVEMENT INDEX: | |||
| – 6-Week Change in Strength Index: | -14.8 | 14.9 | -7.8 |
2-Year Treasury Note Futures:
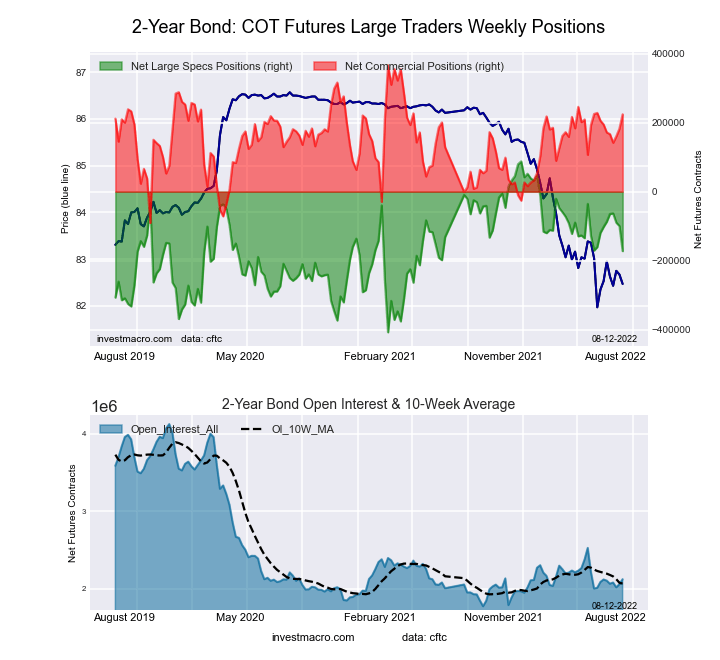
The 2-Year Treasury Note large speculator standing this week was a net position of -172,221 contracts in the data reported through Tuesday. This was a weekly fall of -72,753 contracts from the previous week which had a total of -99,468 net contracts.
This week’s current strength score (the trader positioning range over the past three years, measured from 0 to 100) shows the speculators are currently Bearish with a score of 47.5 percent. The commercials are Bullish with a score of 68.9 percent and the small traders (not shown in chart) are Bearish with a score of 26.9 percent.
| 2-Year Treasury Note Statistics | SPECULATORS | COMMERCIALS | SMALL TRADERS |
| – Percent of Open Interest Longs: | 9.8 | 80.7 | 7.8 |
| – Percent of Open Interest Shorts: | 17.9 | 70.2 | 10.3 |
| – Net Position: | -172,221 | 224,202 | -51,981 |
| – Gross Longs: | 208,434 | 1,712,983 | 165,581 |
| – Gross Shorts: | 380,655 | 1,488,781 | 217,562 |
| – Long to Short Ratio: | 0.5 to 1 | 1.2 to 1 | 0.8 to 1 |
| NET POSITION TREND: | |||
| – Strength Index Score (3 Year Range Pct): | 47.5 | 68.9 | 26.9 |
| – Strength Index Reading (3 Year Range): | Bearish | Bullish | Bearish |
| NET POSITION MOVEMENT INDEX: | |||
| – 6-Week Change in Strength Index: | -14.2 | 6.5 | 16.9 |
5-Year Treasury Note Futures:
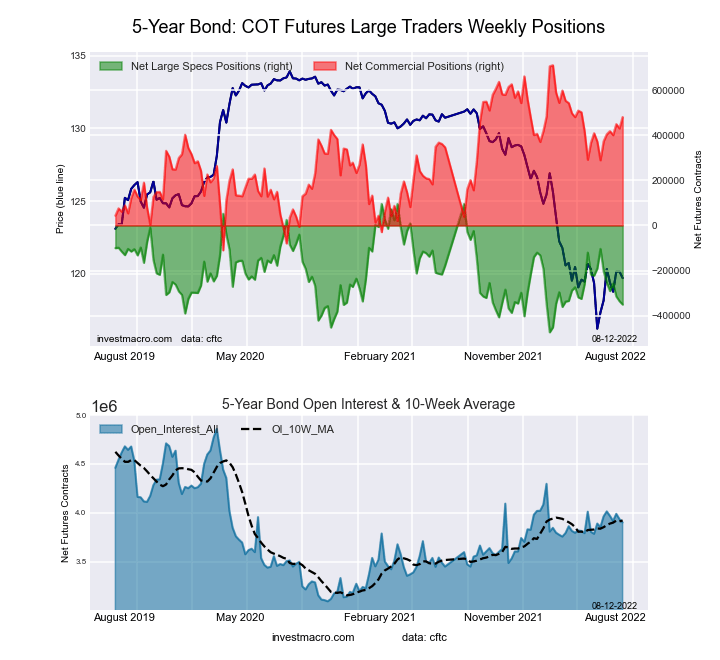
The 5-Year Treasury Note large speculator standing this week was a net position of -351,003 contracts in the data reported through Tuesday. This was a weekly reduction of -15,058 contracts from the previous week which had a total of -335,945 net contracts.
This week’s current strength score (the trader positioning range over the past three years, measured from 0 to 100) shows the speculators are currently Bearish with a score of 21.6 percent. The commercials are Bullish with a score of 72.0 percent and the small traders (not shown in chart) are Bearish with a score of 45.2 percent.
| 5-Year Treasury Note Statistics | SPECULATORS | COMMERCIALS | SMALL TRADERS |
| – Percent of Open Interest Longs: | 7.7 | 83.3 | 7.6 |
| – Percent of Open Interest Shorts: | 16.7 | 71.0 | 10.9 |
| – Net Position: | -351,003 | 481,266 | -130,263 |
| – Gross Longs: | 298,631 | 3,249,286 | 295,805 |
| – Gross Shorts: | 649,634 | 2,768,020 | 426,068 |
| – Long to Short Ratio: | 0.5 to 1 | 1.2 to 1 | 0.7 to 1 |
| NET POSITION TREND: | |||
| – Strength Index Score (3 Year Range Pct): | 21.6 | 72.0 | 45.2 |
| – Strength Index Reading (3 Year Range): | Bearish | Bullish | Bearish |
| NET POSITION MOVEMENT INDEX: | |||
| – 6-Week Change in Strength Index: | -26.0 | 13.1 | 11.1 |
10-Year Treasury Note Futures:
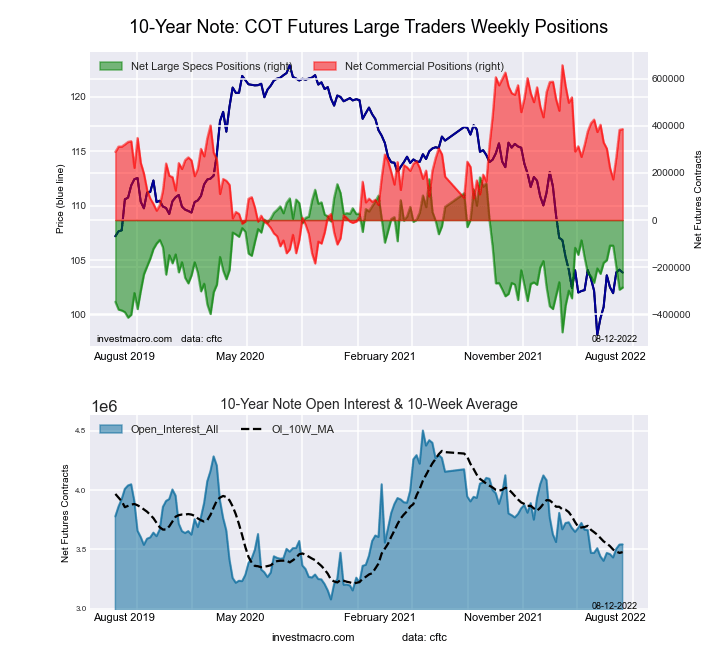
The 10-Year Treasury Note large speculator standing this week was a net position of -286,478 contracts in the data reported through Tuesday. This was a weekly boost of 9,012 contracts from the previous week which had a total of -295,490 net contracts.
This week’s current strength score (the trader positioning range over the past three years, measured from 0 to 100) shows the speculators are currently Bearish with a score of 28.9 percent. The commercials are Bullish with a score of 67.8 percent and the small traders (not shown in chart) are Bullish with a score of 55.9 percent.
| 10-Year Treasury Note Statistics | SPECULATORS | COMMERCIALS | SMALL TRADERS |
| – Percent of Open Interest Longs: | 7.6 | 79.8 | 9.7 |
| – Percent of Open Interest Shorts: | 15.7 | 68.8 | 12.6 |
| – Net Position: | -286,478 | 386,245 | -99,767 |
| – Gross Longs: | 269,699 | 2,824,549 | 344,919 |
| – Gross Shorts: | 556,177 | 2,438,304 | 444,686 |
| – Long to Short Ratio: | 0.5 to 1 | 1.2 to 1 | 0.8 to 1 |
| NET POSITION TREND: | |||
| – Strength Index Score (3 Year Range Pct): | 28.9 | 67.8 | 55.9 |
| – Strength Index Reading (3 Year Range): | Bearish | Bullish | Bullish |
| NET POSITION MOVEMENT INDEX: | |||
| – 6-Week Change in Strength Index: | -15.9 | 6.8 | 11.3 |
Ultra 10-Year Notes Futures:
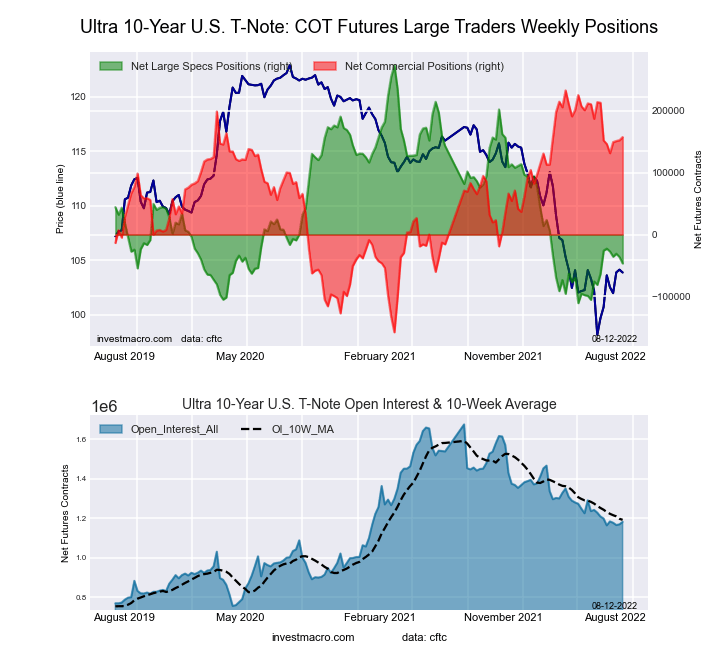
The Ultra 10-Year Notes large speculator standing this week was a net position of -46,667 contracts in the data reported through Tuesday. This was a weekly reduction of -10,376 contracts from the previous week which had a total of -36,291 net contracts.
This week’s current strength score (the trader positioning range over the past three years, measured from 0 to 100) shows the speculators are currently Bearish-Extreme with a score of 16.7 percent. The commercials are Bullish-Extreme with a score of 80.7 percent and the small traders (not shown in chart) are Bullish with a score of 53.2 percent.
| Ultra 10-Year Notes Statistics | SPECULATORS | COMMERCIALS | SMALL TRADERS |
| – Percent of Open Interest Longs: | 4.8 | 83.5 | 10.9 |
| – Percent of Open Interest Shorts: | 8.8 | 70.2 | 20.3 |
| – Net Position: | -46,667 | 157,510 | -110,843 |
| – Gross Longs: | 56,978 | 986,942 | 128,400 |
| – Gross Shorts: | 103,645 | 829,432 | 239,243 |
| – Long to Short Ratio: | 0.5 to 1 | 1.2 to 1 | 0.5 to 1 |
| NET POSITION TREND: | |||
| – Strength Index Score (3 Year Range Pct): | 16.7 | 80.7 | 53.2 |
| – Strength Index Reading (3 Year Range): | Bearish-Extreme | Bullish-Extreme | Bullish |
| NET POSITION MOVEMENT INDEX: | |||
| – 6-Week Change in Strength Index: | -5.4 | 1.4 | 9.9 |
US Treasury Bonds Futures:
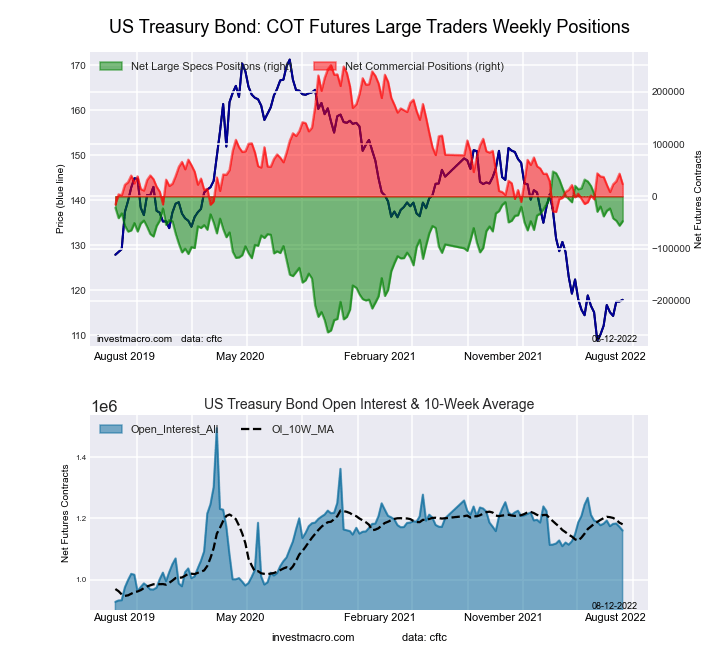
The US Treasury Bonds large speculator standing this week was a net position of -47,586 contracts in the data reported through Tuesday. This was a weekly advance of 8,467 contracts from the previous week which had a total of -56,053 net contracts.
This week’s current strength score (the trader positioning range over the past three years, measured from 0 to 100) shows the speculators are currently Bullish with a score of 69.1 percent. The commercials are Bearish-Extreme with a score of 19.0 percent and the small traders (not shown in chart) are Bullish with a score of 71.8 percent.
| US Treasury Bonds Statistics | SPECULATORS | COMMERCIALS | SMALL TRADERS |
| – Percent of Open Interest Longs: | 7.6 | 77.2 | 14.5 |
| – Percent of Open Interest Shorts: | 11.7 | 75.2 | 12.4 |
| – Net Position: | -47,586 | 23,404 | 24,182 |
| – Gross Longs: | 87,700 | 896,500 | 168,639 |
| – Gross Shorts: | 135,286 | 873,096 | 144,457 |
| – Long to Short Ratio: | 0.6 to 1 | 1.0 to 1 | 1.2 to 1 |
| NET POSITION TREND: | |||
| – Strength Index Score (3 Year Range Pct): | 69.1 | 19.0 | 71.8 |
| – Strength Index Reading (3 Year Range): | Bullish | Bearish-Extreme | Bullish |
| NET POSITION MOVEMENT INDEX: | |||
| – 6-Week Change in Strength Index: | -3.0 | -4.9 | 18.2 |
Ultra US Treasury Bonds Futures:
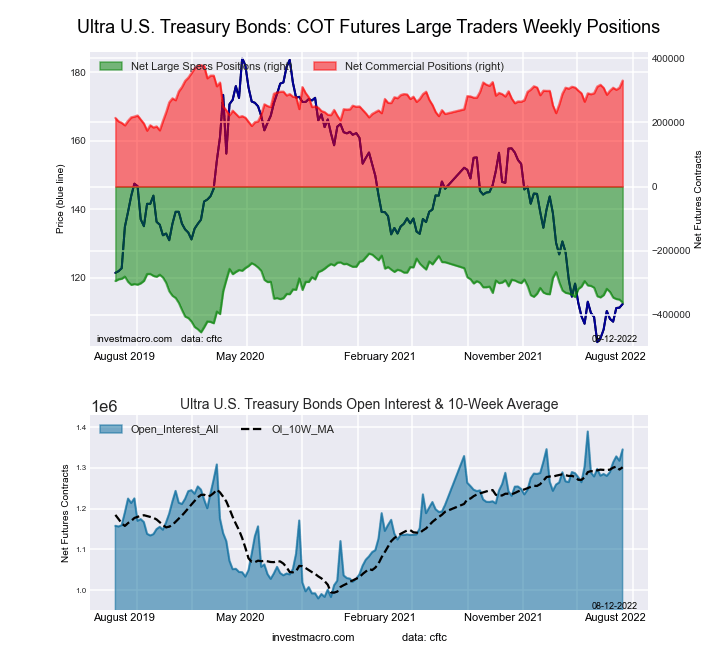
The Ultra US Treasury Bonds large speculator standing this week was a net position of -361,316 contracts in the data reported through Tuesday. This was a weekly decrease of -9,201 contracts from the previous week which had a total of -352,115 net contracts.
This week’s current strength score (the trader positioning range over the past three years, measured from 0 to 100) shows the speculators are currently Bearish with a score of 37.8 percent. The commercials are Bullish with a score of 76.6 percent and the small traders (not shown in chart) are Bullish with a score of 50.7 percent.
| Ultra US Treasury Bonds Statistics | SPECULATORS | COMMERCIALS | SMALL TRADERS |
| – Percent of Open Interest Longs: | 3.6 | 84.2 | 10.4 |
| – Percent of Open Interest Shorts: | 30.4 | 59.6 | 8.1 |
| – Net Position: | -361,316 | 330,124 | 31,192 |
| – Gross Longs: | 47,821 | 1,132,208 | 139,719 |
| – Gross Shorts: | 409,137 | 802,084 | 108,527 |
| – Long to Short Ratio: | 0.1 to 1 | 1.4 to 1 | 1.3 to 1 |
| NET POSITION TREND: | |||
| – Strength Index Score (3 Year Range Pct): | 37.8 | 76.6 | 50.7 |
| – Strength Index Reading (3 Year Range): | Bearish | Bullish | Bullish |
| NET POSITION MOVEMENT INDEX: | |||
| – 6-Week Change in Strength Index: | -9.5 | 11.2 | 0.4 |
*COT Report: The COT data, released weekly to the public each Friday, is updated through the most recent Tuesday (data is 3 days old) and shows a quick view of how large speculators or non-commercials (for-profit traders) were positioned in the futures markets.
The CFTC categorizes trader positions according to commercial hedgers (traders who use futures contracts for hedging as part of the business), non-commercials (large traders who speculate to realize trading profits) and nonreportable traders (usually small traders/speculators) as well as their open interest (contracts open in the market at time of reporting).
See CFTC criteria here.
More By This Author:
Currency Speculators Trim Japanese Yen Bearish Bets While Brazilian Real Bets Fall To Bearish Level
COT Week 31 Charts: Soft Commodities Speculator Bets Rose Higher This Week Led By Corn & Soybean Oil
Bonds Speculators Bets Drop This Week Led By Fed Funds, Eurodollar & 10-Year Bond


Comments
Log in or sign up to join the conversation.