
Back In A Sideways Regime…

Image Source: Pixabay
Summary: SPX and QQQs failed their breakout last Friday, closing out the week on their lows. This typically leads to further downside volatility in the near term. Internals continue to weaken, along with the backdrop of an elevated Trend Fragility score. We should expect continued chop and vol until the market can put in a proper breakout in either direction. Lastly, AUDUSD and Bonds are setting up for bullish breakouts.
Alright, let’s get to it.
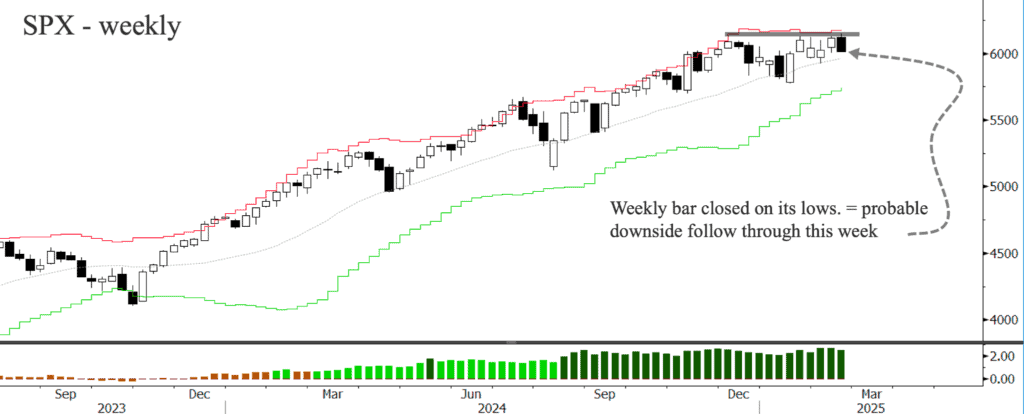
1. SPX saw a breakout failure last Friday after briefly pushing above its 3-month sideways range. The weekly candle went out on its lows. This increases the probability we’ll see some more downside follow-through this week.
(Click on image to enlarge)
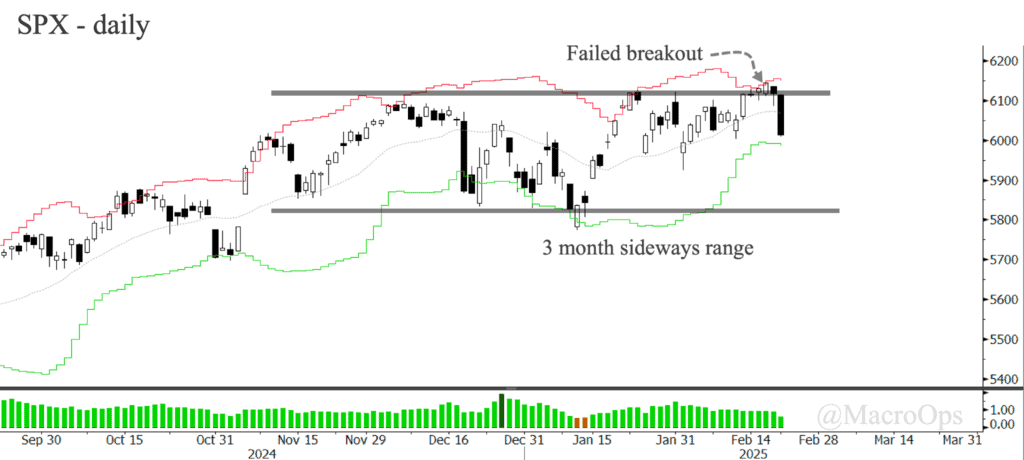
2. What does this mean? Not much, yet. Price action is back in its larger sideways range. So we should expect more chop and vol. And any action within this sideways range is noise. We’ll need to wait for a breakout in either direction for some clarity.
(Click on image to enlarge)
3. The long-term bull trend is still intact, but because we (1) got a breakout failure, (2) saw a further weakening in internals, and (3) Trend Fragility remains elevated, we’re not interested in expressing conviction on near-term price action. So we flattened our tactical beta positions last week and are back to patiently waiting for the market to tip its hand.
(Click on image to enlarge)

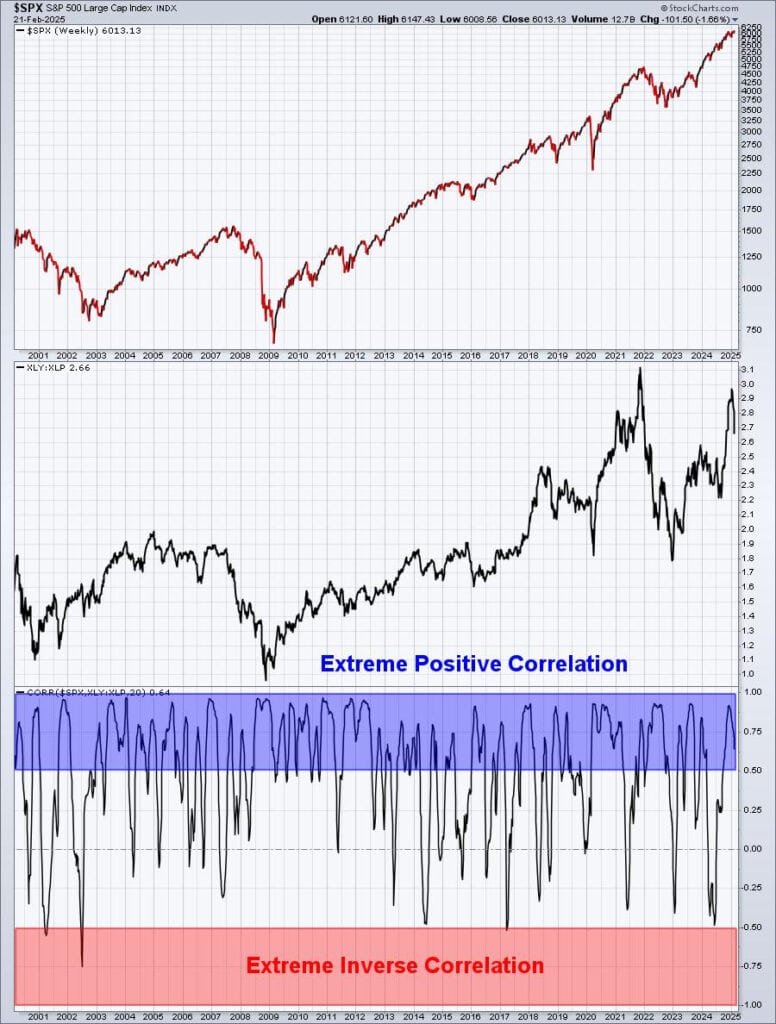
4. Tom Bowley shared this chart (here’s his post h/t @PhilD) over the weekend, writing:
This ratio (XLY:XLP) has a VERY strong positive correlation with the S&P 500. In other words, when the S&P 500 advances, a corresponding rise in the XLY:XLP ratio is to be expected. When it doesn’t rise to corroborate the benchmark’s rally, it typically leads to lack of S&P 500 follow through….I found that this type of disparity where the XLY underperforms the XLP by such a large margin has occurred only 10 times since the financial-crisis-related bear market that ended in March 2009. 8 of those times happened during bear markets and 1 happened during a correction. Friday was the 10th. This type of massive rotation from offense to defense should not be overlooked.
(Click on image to enlarge)
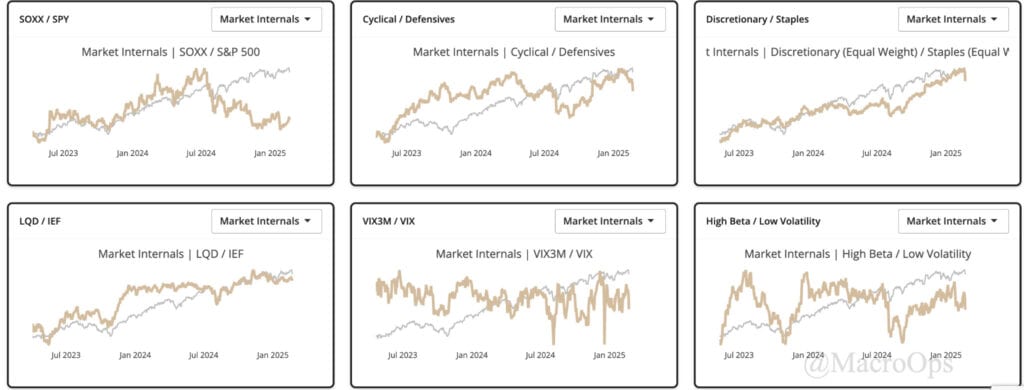
5. We agree with Tom that this is a concerning data point. And it’s not just XLY:XLP, but the other key internals we track are trading in the wrong direction.
(Click on image to enlarge)
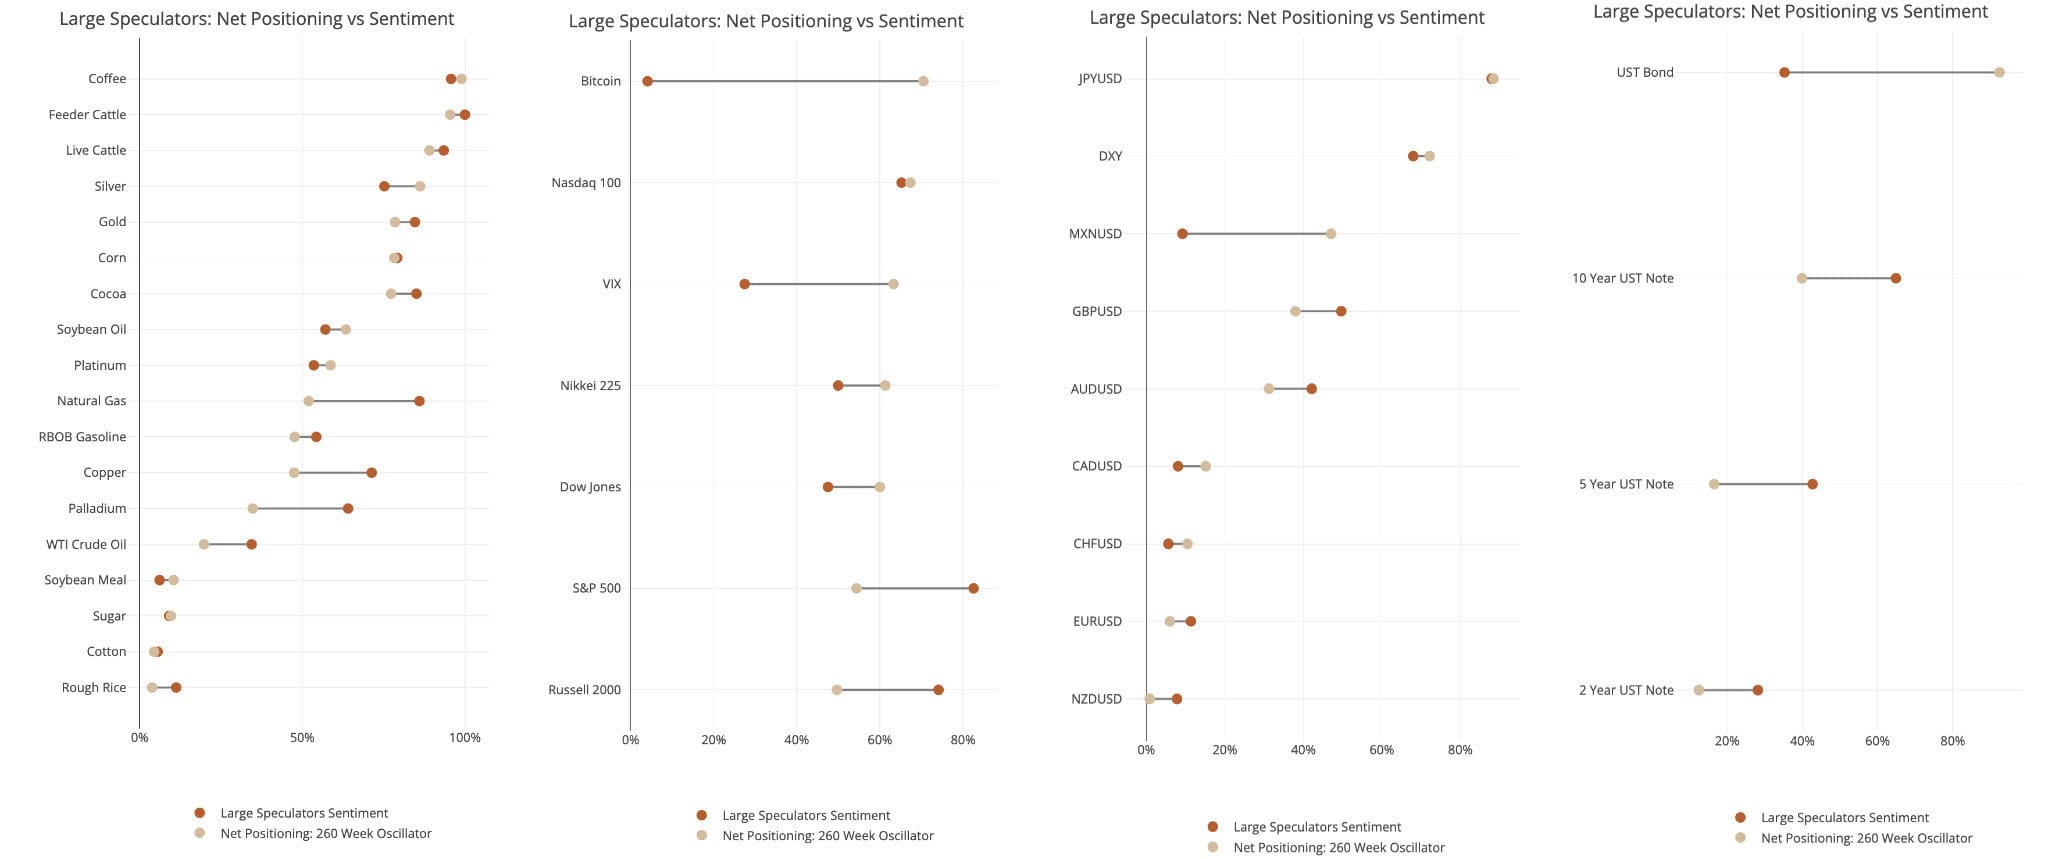
6. Here’s our CoT and Sentiment scores for the markets we trade.
(Click on image to enlarge)
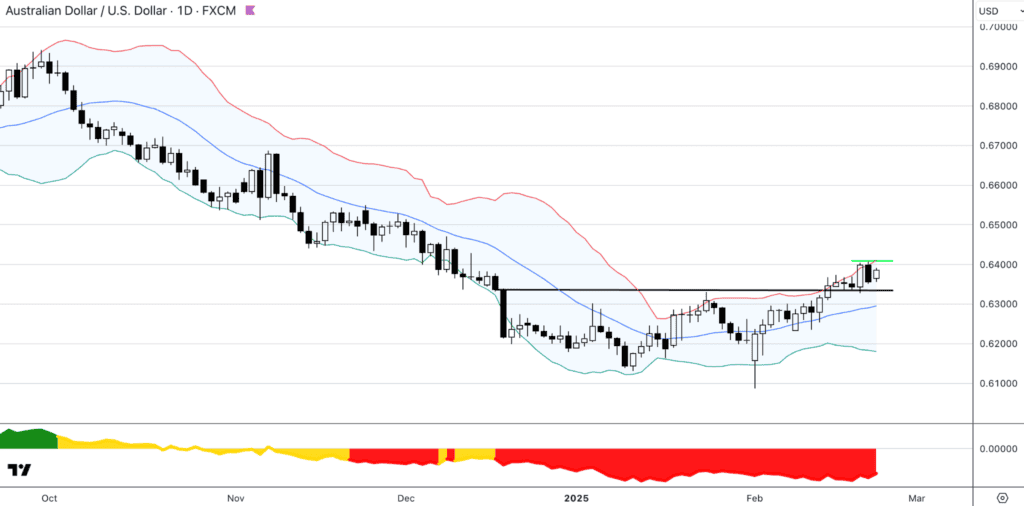
7. We talked about the larger setups in several USD pairs last week, including AUDUSD. We’re putting in buy orders above its recent swing high and will get long if the market can pull us in.
(Click on image to enlarge)
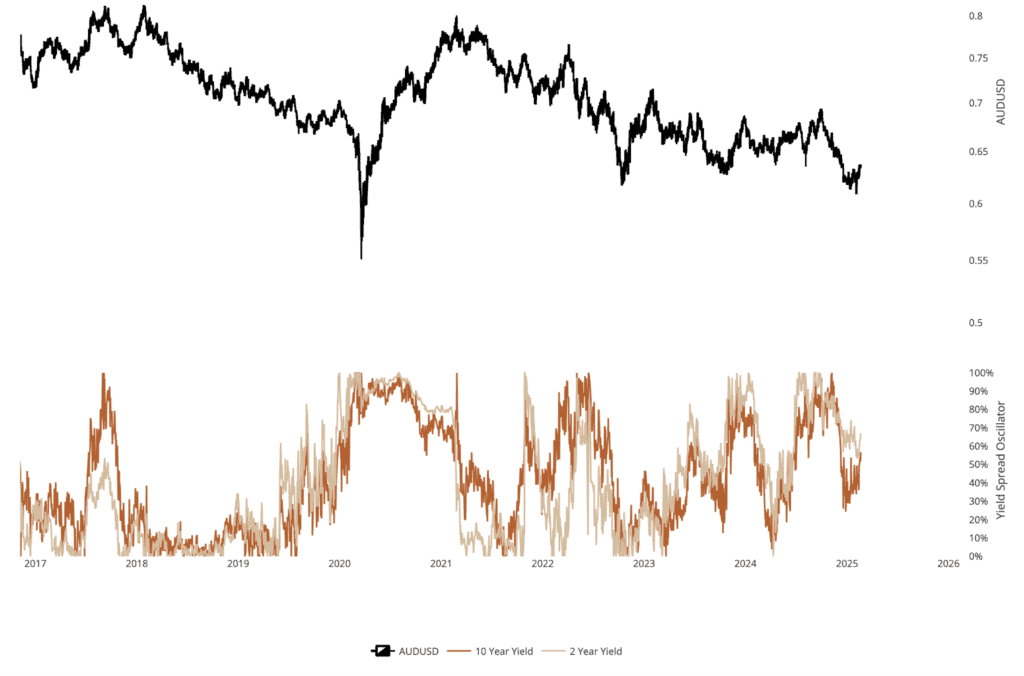
8. AUDUSD’s yield spread oscillator is above 50% and starting to turn up.
(Click on image to enlarge)
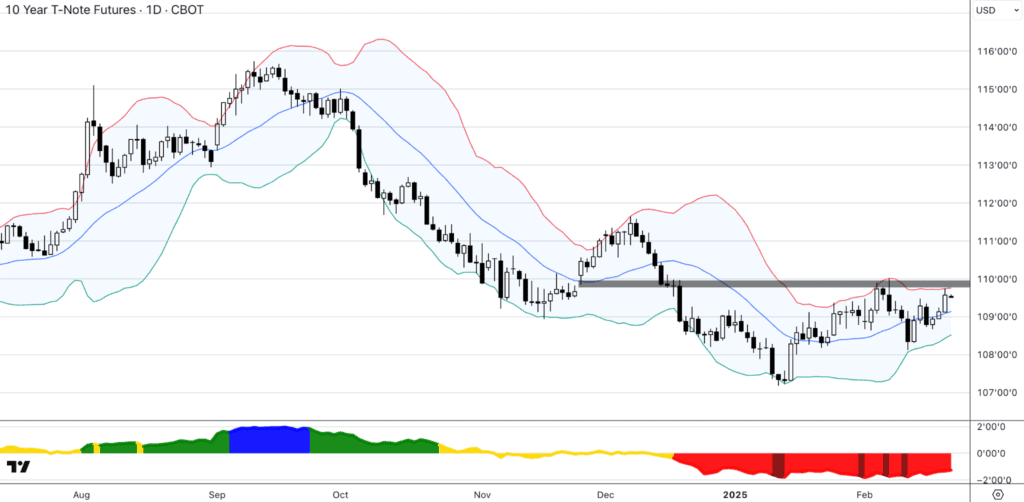
9. And if bonds can keep catching a bid here, driving them above the neckline of their potential H&S bottom, then that’ll give these USD fade trades a nice tailwind. We’re currently long GBP, have orders on in CAD, and will be adding AUD this week if we see positive follow-through.
(Click on image to enlarge)
More By This Author:
Flooding The Zone…The Tale Of Two Mining Companies
Soft For Hard Swap…
Disclaimer: All statements are solely opinions and are for educational purposes only.


