
President Trump proposed, with the full support of Federal Housing Director Bill Pulte, that homeowners be allowed to take out 50-year mortgages. The goal is to make housing more affordable, especially for younger generations who lack real estate equity and face high home prices and elevated mortgage rates. Read more about the sad state of first-time homebuyers in a section below.
There are several ways to make homes more affordable. The two obvious ones are lower mortgage rates and home prices. While lower mortgage rates would help on the margin, home prices have outpaced median incomes. Declining home prices are a welcome answer, but the impact on existing homeowners could be economically devastating. Since there is no great solution, the administration offers 50 year mortgages. To appreciate the pros and cons of a 50 year versus a 30 year mortgage, we compare a 50 and 30 year mortgage for $500,000 at 6.50%.
The benefit of a longer mortgage is lower monthly payments. In our example, the extra 20 years would reduce the monthly payment by $341. However, the homeowner will be docked as follows:
- Less equity appreciation: As the graph below shows, the 50 year mortgage only has 24% equity when the 30 year mortgage ends.
- When the 30 year mortgage is paid off, the 50 year homeowner still owes $378,000.
- Through the life of the 50 year mortgage, the homeowner will pay an additional $553,000 in interest versus a 30 year alternative.
Given that most people stay in houses for about 12 years on average, the 50 year proposal, which generates little homeowners’ equity, is much more of a rental-like arrangement than a purchase.

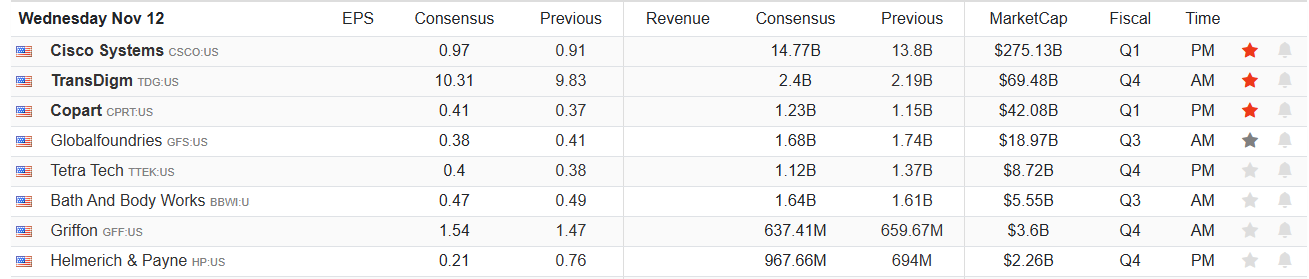
What To Watch Today
Earnings
(Click on image to enlarge)
Economy
(Click on image to enlarge)

Market Trading Update
Yesterday, we discussed that we are entering into the strongest seasonal months of the year, which bodes well for remaining invested into year-end. Recently, Treasury bonds have been under pressure after falling below 4% on the 10-year Treasury. That reversal was not unexpected, as we noted previously, given the short-term overbought conditions. However, today is the 10-year Treasury Bond auction. Historically, it is not uncommon to see bond traders push yields higher heading into an auction to try to buy them at a somewhat lower price. With bonds oversold, as shown in the chart below, and sitting on the rising trend line from the recent lows, we should expect to see bonds bid higher after the auction today.
(Click on image to enlarge)

From a trading perspective, the trend is bullish, and a rally above 91 on the 20+ Year Treasury Bond ETF (TLT) will likely trigger a momentum buy signal, pushing the price toward 93. That move higher in bond prices, which would push yields back below 4%, would also coincide with another Fed rate cut in December, and continued strength in the dollar rally as of late.
(Click on image to enlarge)
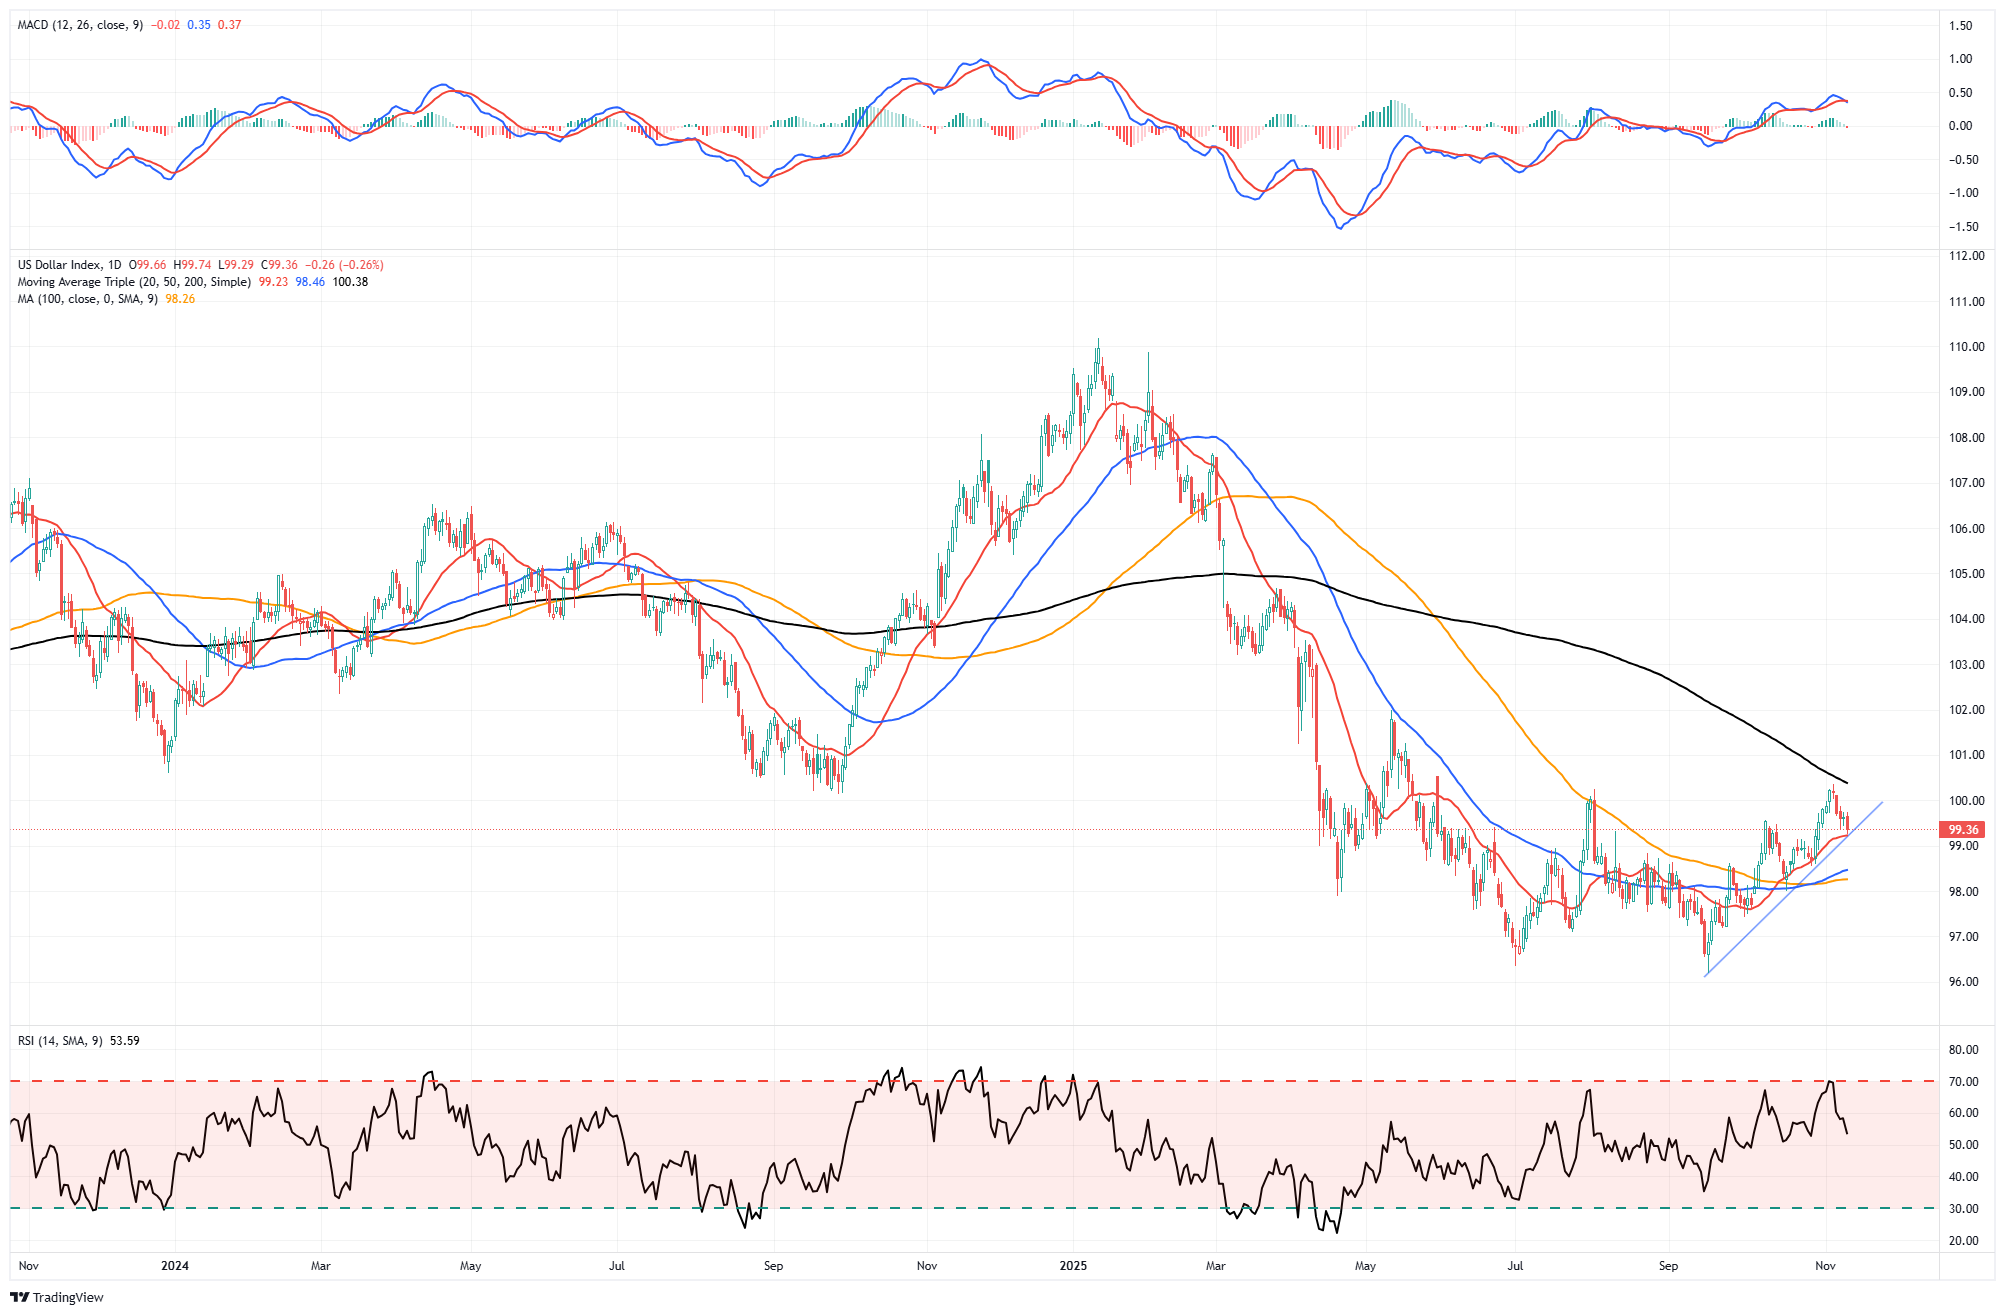
We are watching the action in both bonds and the dollar closely as it will ultimately impact other asset prices that are dollar and rate-sensitive.
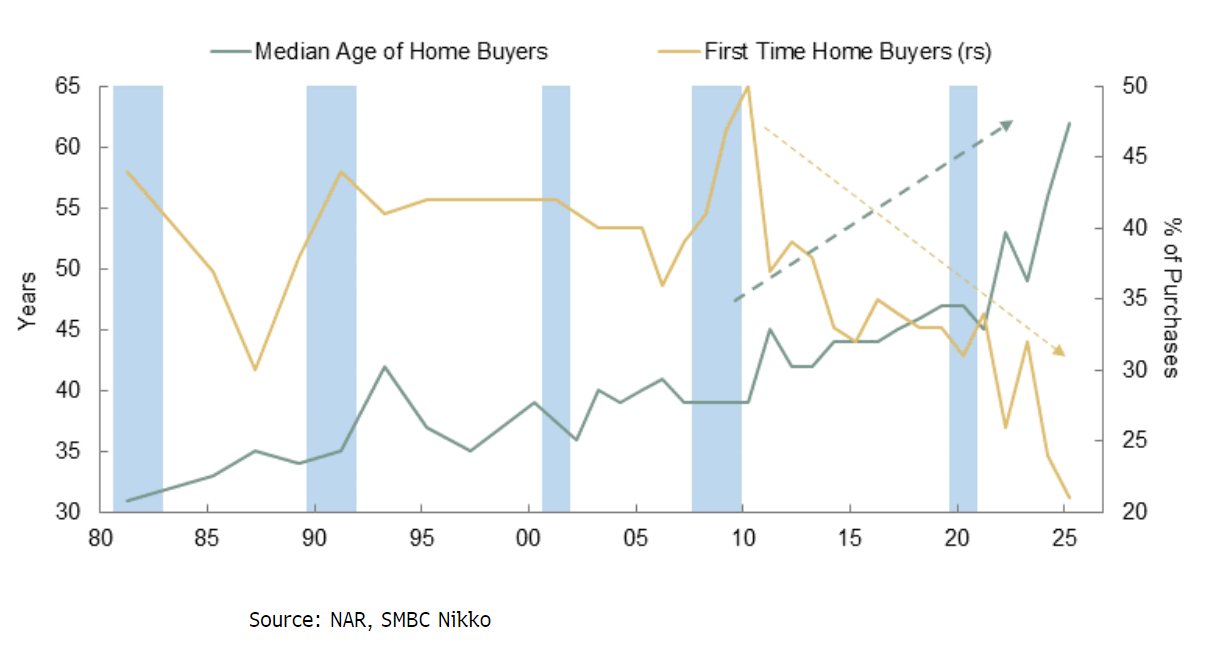
First-Time Homeowners Are Not Feeding The Housing Market Pyramid
The housing market is a bit like a pyramid scheme. While not a scheme exactly, it relies heavily on new entrants to support existing homeowners. Typically, first-time home buyers purchase the lowest-priced houses, often called starter homes. These transactions allow older first-time buyers to move up to bigger houses and or houses in a more desirable location. Those purchases then allow more established homeowners to sell their houses as they retire or move into an even more desirable home. The bottom line is that new home buyers feed the entire real estate market.
The graph below shows that the foundation of the real estate market —first-time home buyers —is weak. The median age of a US home buyer is at a record high of 61 years, while the share of first-time buyers has fallen to a record low of 21%.
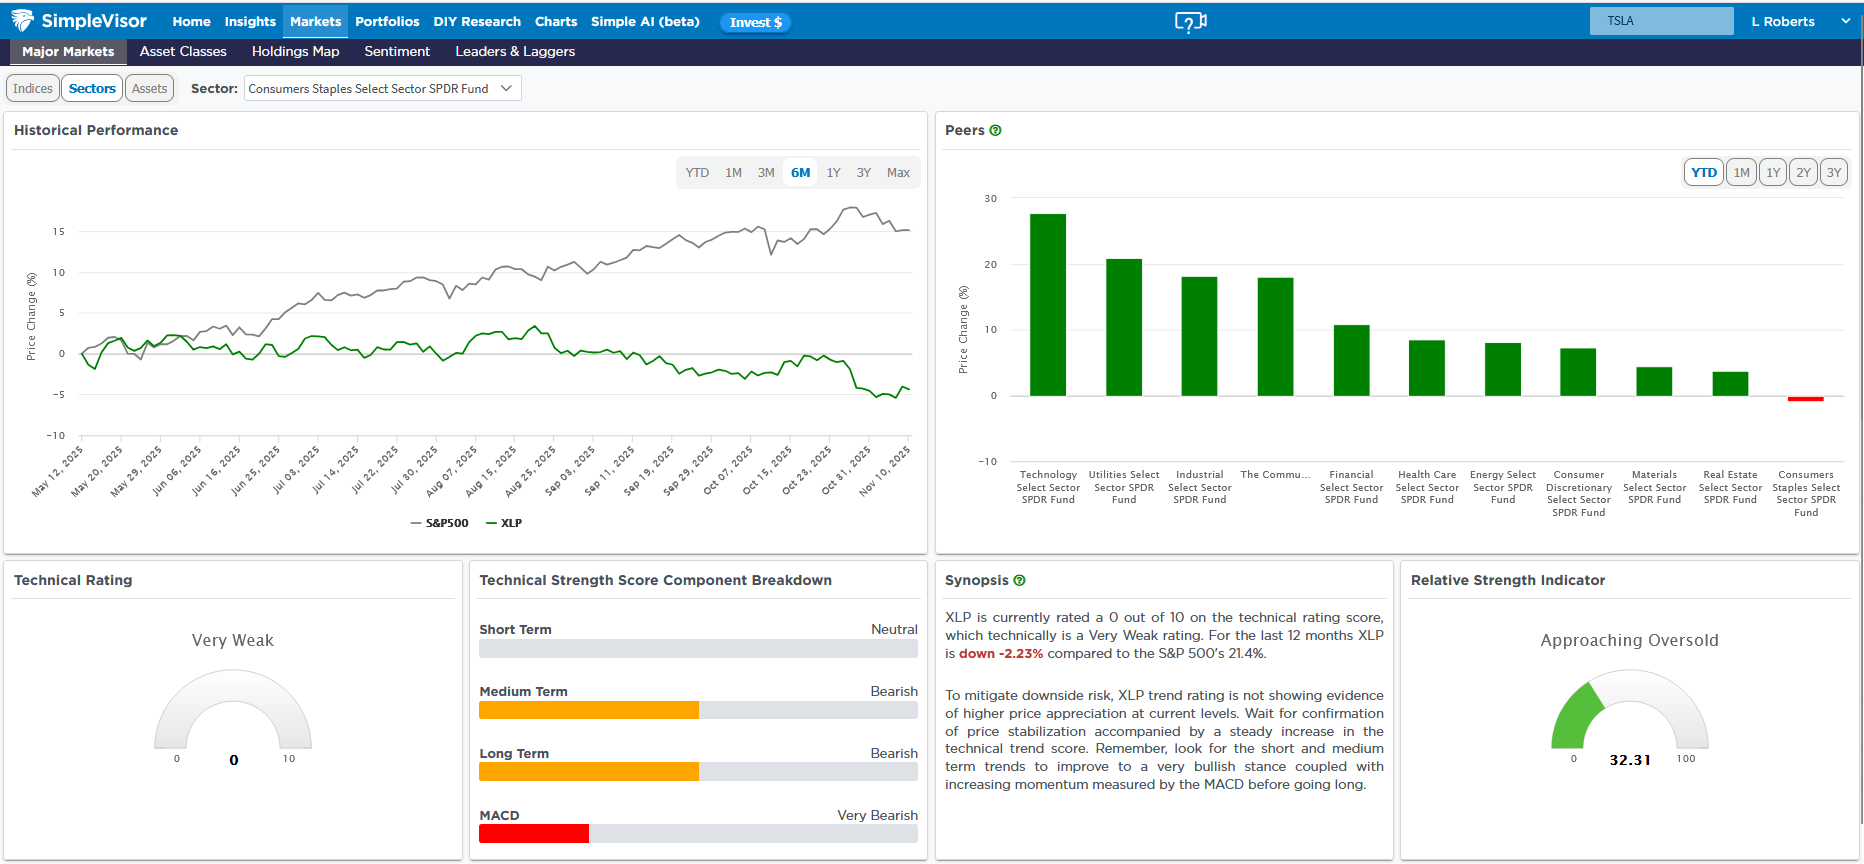
A Simple Look At Consumer Staples
While the broader market indexes are having a great year, led by the largest-cap stocks, technology, and AI-related companies, other sectors, such as consumer staples, are languishing. At some point, the market will rotate toward consumer staples and other out-of-favor stocks. To help foresee which sectors and stocks may outperform in the future, we share the page below from SimpleVisor. The two graphics at the top of the page show the relative performance of staples versus the S&P (left) and versus the other sectors (right). The relative performance versus the S&P 500 is almost mirror-like. Often, the S&P 500 and staples move in the same direction, though one may outperform the other. The current divergence is rare. The bar chart shows the underperformance of staples relative to the other sectors.
The bottom of the graphic highlights that the technical rating for staples is bad. Such is not surprising. However, note that the sector is oversold, while most other sectors are overbought. We have little doubt that staples will, in time, see a favorable rotation, but there is nothing to suggest the underperformance won’t continue for the time being.
Tweet of the Day

More By This Author:
An Economic Data Flood Is Coming: Does It Matter?Forward Return And The Importance Of Math
One Trillion Dollar Package For Musk If He Delivers


Comments
Log in or sign up to join the conversation.