

Image Source: Unsplash
Bitcoin has been all the rage in the financial markets lately. After it surpassed 50000, headline after headline has come out about it making new all-time highs.
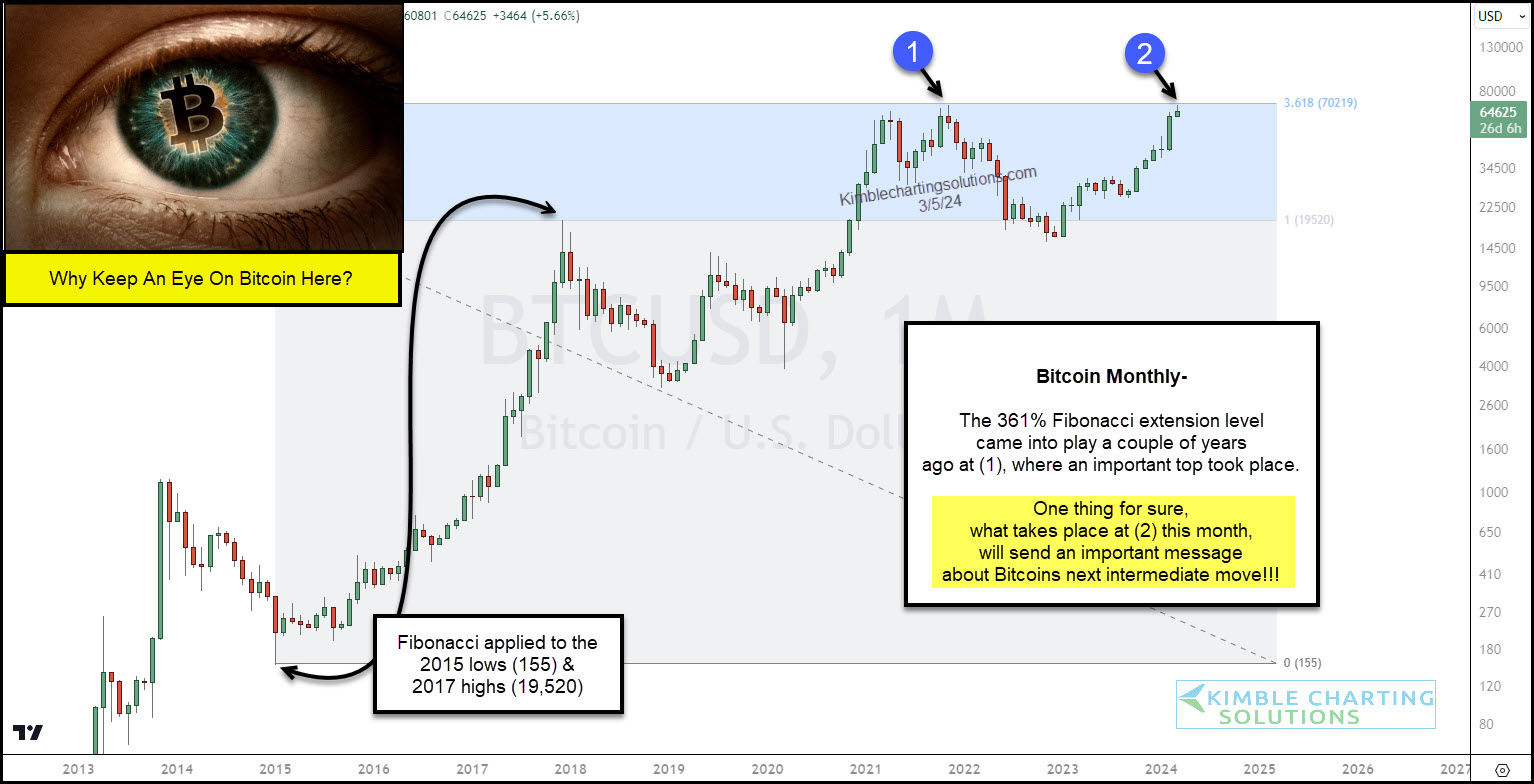
Well, it finally happened. And Bitcoin’s price has retreated a little since.
As you can see on today’s “monthly” chart, Bitcoin is basically trading at the highs that formed two years ago – see points (1) and (2). But, more importantly, Bitcoin is trading at its 161% Fibonacci price extension level. This resistance level stopped the last rally at (1)… will it stop (or stall) this rally at (2)?
One thing is for sure: What happens next at (2) is worth keeping a close eye on!!!
(Click on image to enlarge)
More By This Author:
Equal Weight S&P 500 Testing Key Fibonacci Extension Level
Gold Makes History With Highest Weekly Closing Price In History
2 Under-Performing Stock Market Indices Eye Fibonacci Breakouts


Comments
Log in or sign up to join the conversation.