
Equal Weight S&P 500 Testing Key Fibonacci Extension Level
(Click on image to enlarge)
The latest stock market rally has taken several key indices to new highs.
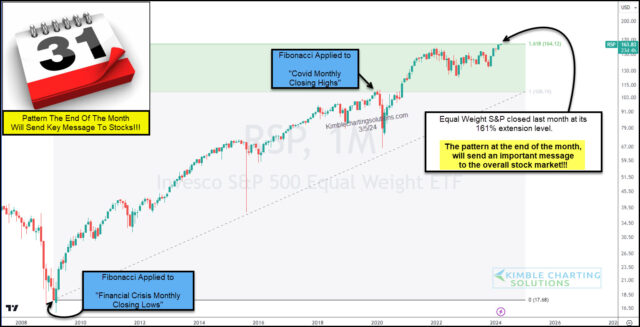
One such index is the Equal Weight S&P 500. While this is bullish, today’s long-term “monthly” chart of the Equal Weight S&P 500 ETF (RSP) shows the price running into a big Fibonacci resistance level.
As you can see, the Equal-weight S&P 500 closed right at its 161% Fibonacci extension level last month.
It will be very interesting to see what type of pattern we see developing this month. Breakout? Or is bearish reversal lower?
What happens next should send an important message to stocks! Stay tuned!!
More By This Author:
Gold Makes History With Highest Weekly Closing Price In History
2 Under-Performing Stock Market Indices Eye Fibonacci Breakouts
Semiconductors ETF Rally Reaches Historic Dual Price Resistance/Breakout Level
Disclosure: Sign up for Chris's Kimble Charting Solutions' email alerts--click here.


