
It is fair to say that the stock market has been lead higher by technology stocks and large cap stocks, in general.
But two stock market indices that historically have been key to broad market rallies have under-performed: the small cap Russell 2000 Index and the broad-based Value Line Geometric Composite.
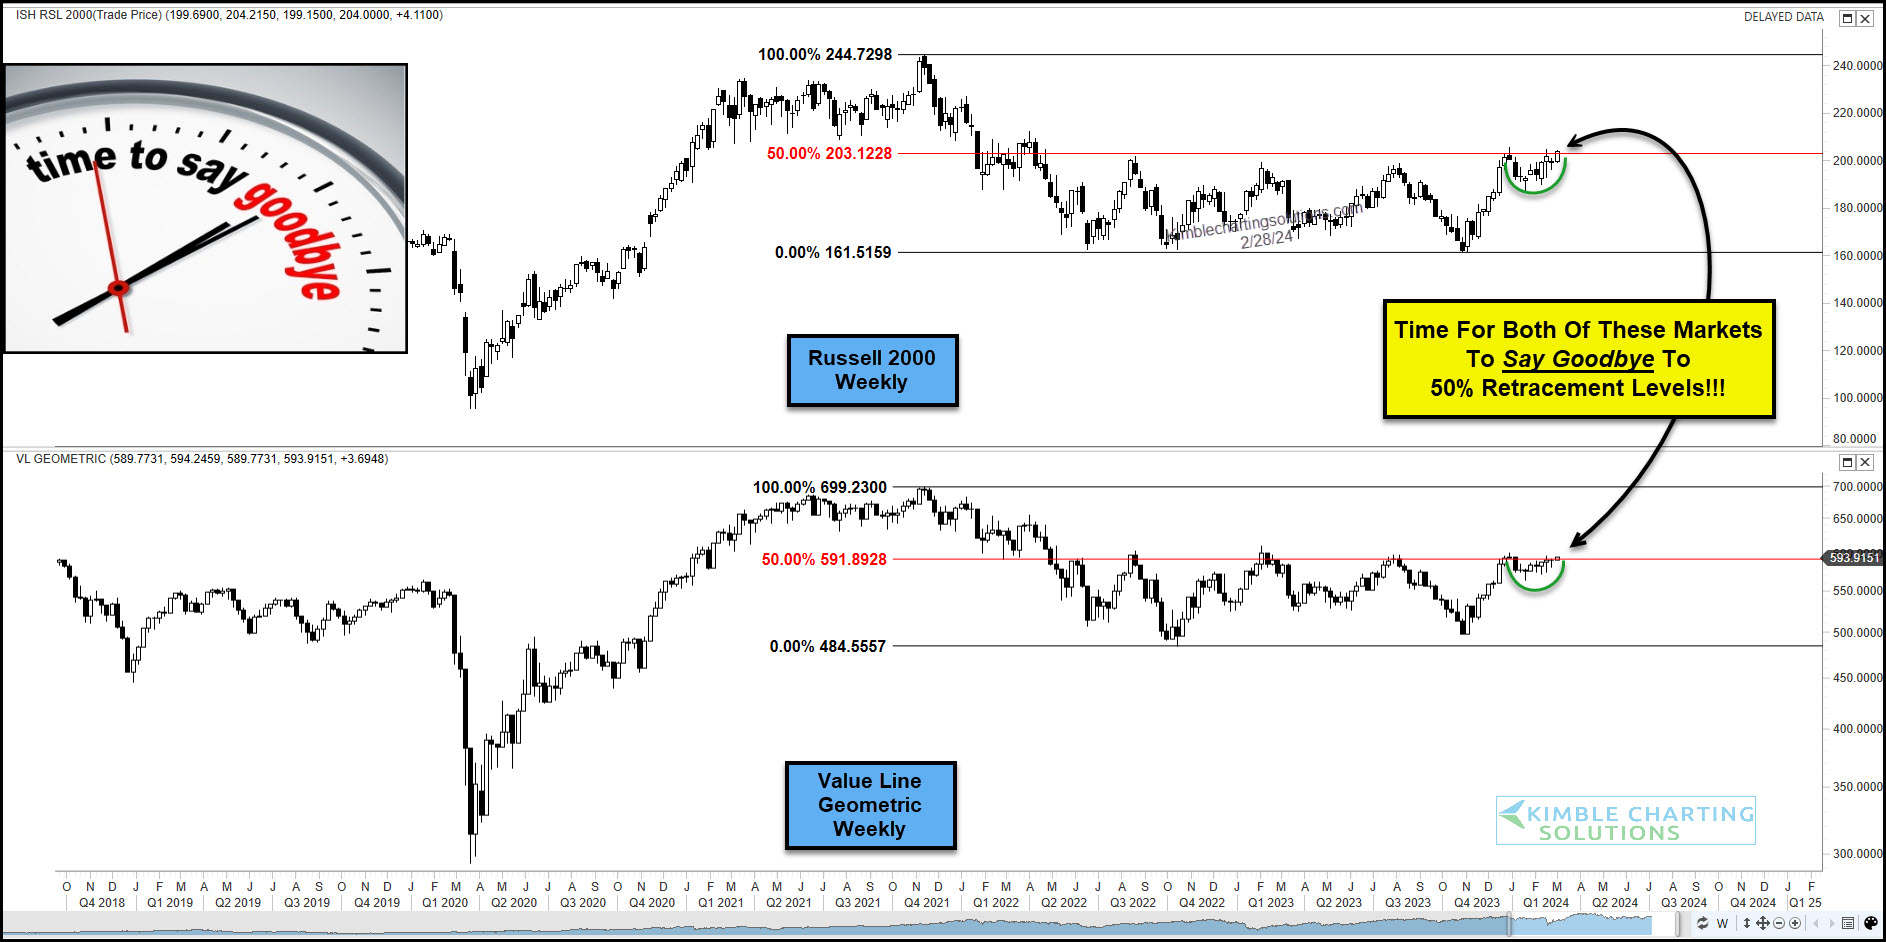
That said, both are trading at key breakout resistance levels as today’s “weekly” chart 2-pack shows.
As you can see, both indices are testing the 50% fibonacci retracement level.
A breakout would be bullish for these indices (as well as the broader market), while continued trade below these levels would indicate lagging performance.
Looks like it might be time to say goodbye to these levels, one way or the other!
(Click on image to enlarge)
More By This Author:
Semiconductors ETF Rally Reaches Historic Dual Price Resistance/Breakout LevelNvidia’s Stock Reaches Key Fibonacci Extension Level
Natural Gas Crashes Into Historic 25-Year Price Support


Comments
Log in or sign up to join the conversation.