

Image Source: Pixabay
I don’t have a resolution to the debate, but I have an insight, regarding per capita series (which is different from aggregate statistics used to determine a recession), summarized in a couple of graphs.
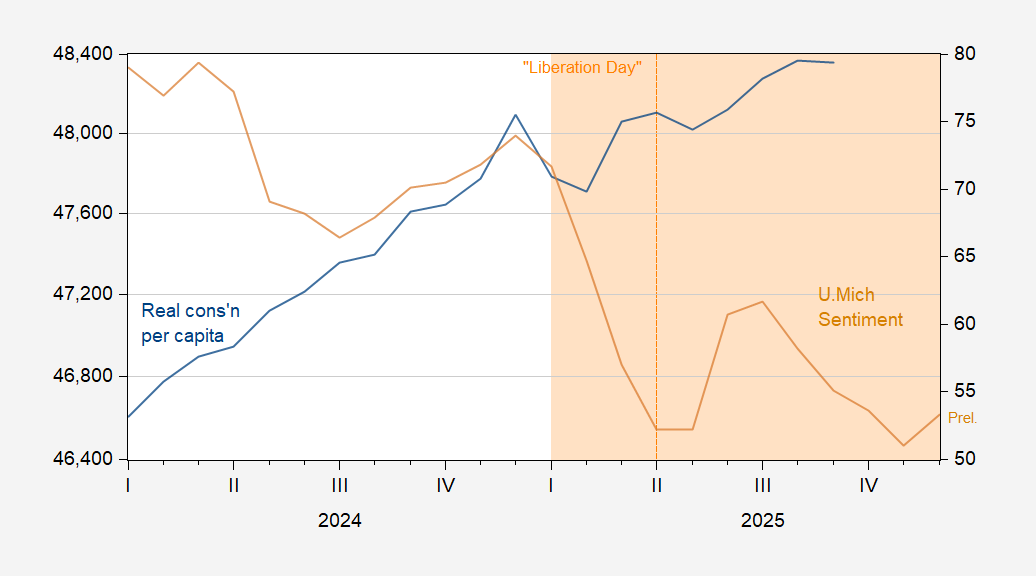
Figure 1: Real consumption per capita, in Ch.2017$ SAAR (blue, left log scale), and U.Michigan Consumer Sentiment (tan, right scale). FRED population series POPTHM used to calculate per capita consumption. December Sentiment in preliminary. Source: BEA via FRED, U.Michigan Survey of Consumers, and author’s calculations.
Note that not only has consumption per capita flatlined, per capita real retail sales is now below November 2024 peak.
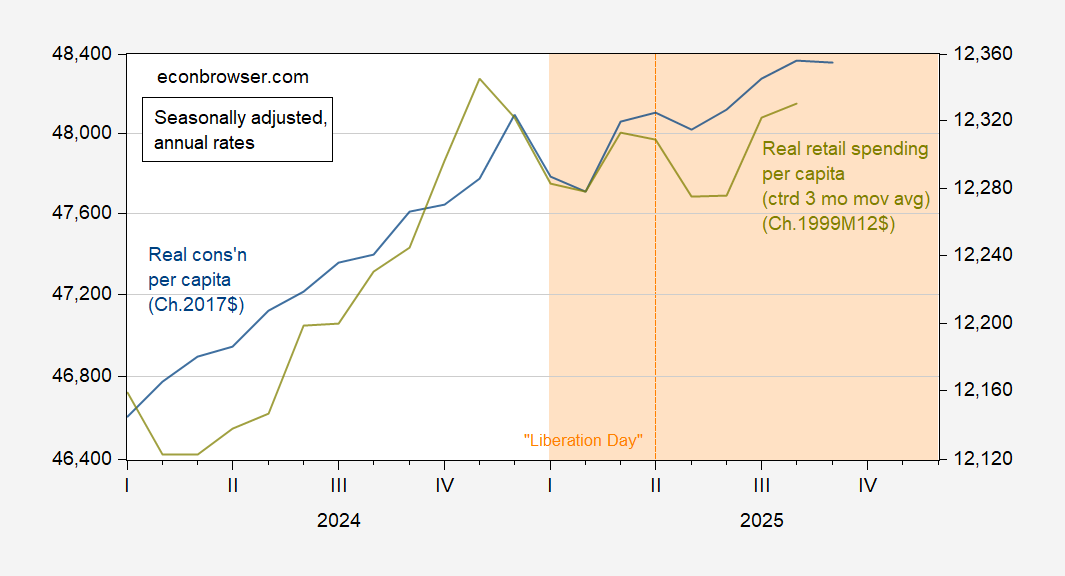
Figure 2: Real consumption per capita, in Ch.2017$ SAAR (blue, left log scale), real retail sales per capita, in Ch.1999M12$ (chartreuse, right log scale). Retail sales series deflated using chained CPI, seasonally adjusted by author using X-13. FRED population series POPTHM used to calculate per capita series. Source: BEA , BLS via FRED, and author’s calculations.
More By This Author:
Instantaneous PCE Core Inflation At 2.6%
Confidence Down In November, (Preliminary) Sentiment (Slightly) Up In December
Business Cycle Indicators: Series At Or Below Prior Peak


Comments
Log in or sign up to join the conversation.