

Image Source: Pixabay
A reliable source for recession forecasting is the unemployment rate (UER), which can provide signals for the beginnings and ends of recessions. The model was published in 2012 and had correctly signaled the 2020 recession. The latest UER (August 2023) is 3.8%, signifying no recession. However, if the September UER is 4% or higher, a recession will be signaled, according to the model.
The following indicators are used to signal recession starts:
- A short 12-period and a long 60-period exponential moving average (EMA) of the unemployment rate (UER),
- The eight-month smoothed annualized growth rate of the UER (UERg).
- The 19-week rate of change of the UER.
The criteria for the model to signal the start of recessions are given in the original 2012 article and repeated in the Appendix. As previously mentioned, the model had correctly signaled the 2020 recession in March 2020.
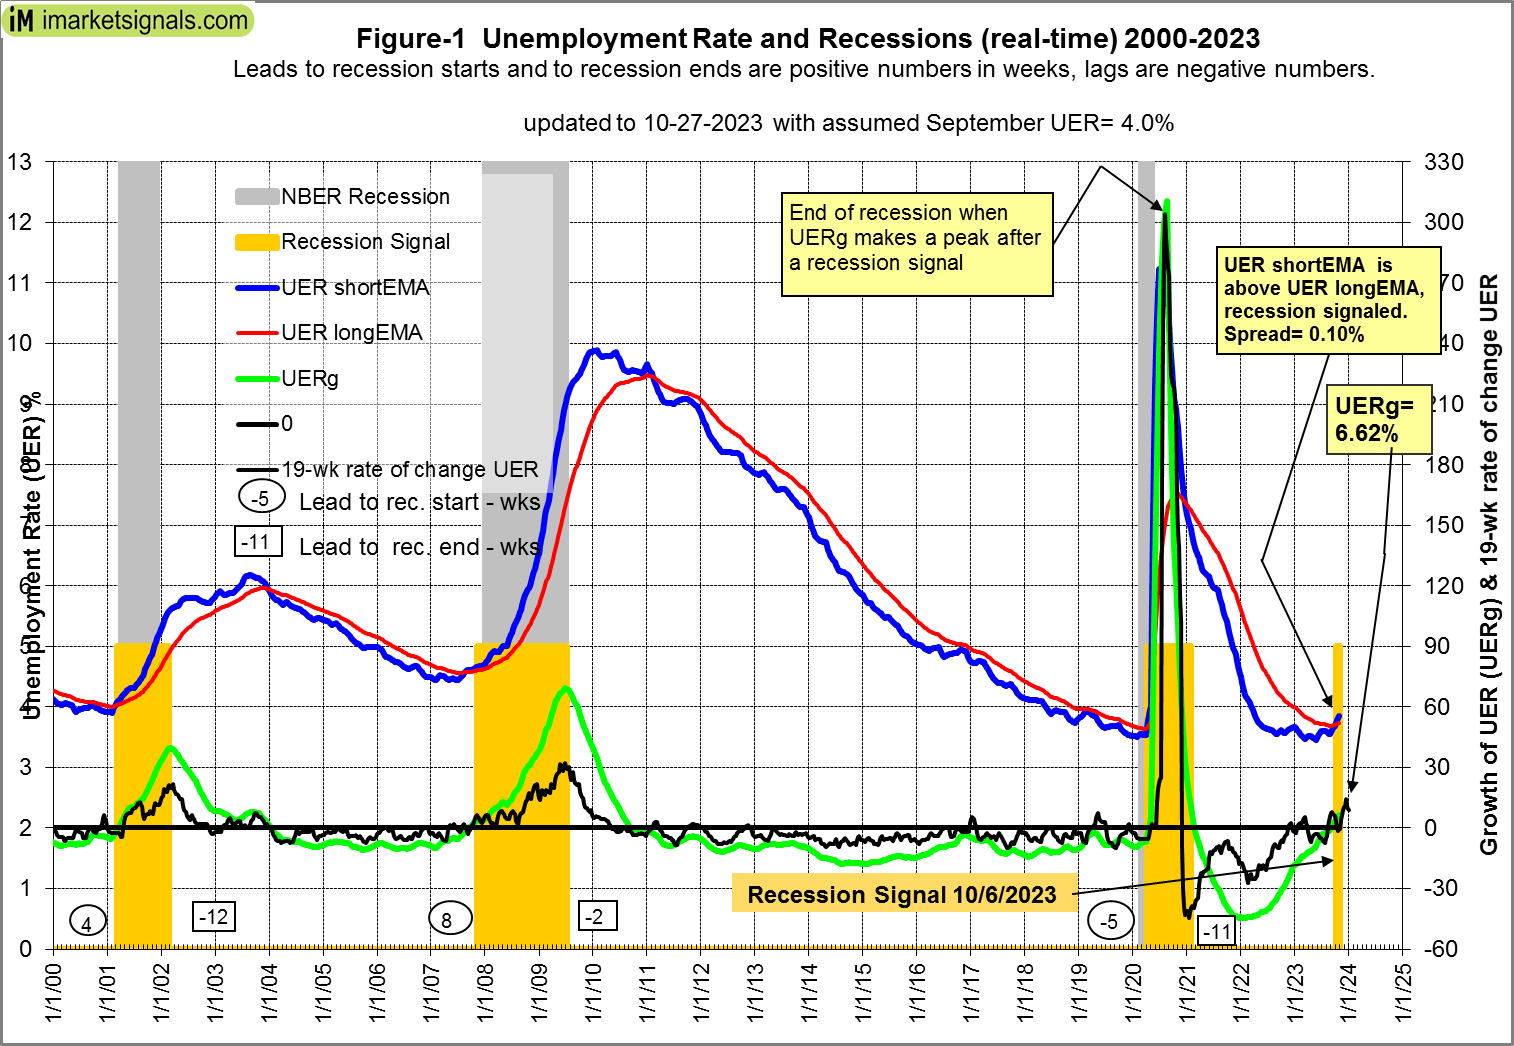
Referring to Figure-1 (with an assumed UER of 4.0% for September 2023), and looking at the end portion of it, one can see that all three conditions for a recession signal will have been met.
- The UER formed a trough and its short EMA is above its long EMA – the blue and red lines, respectively, the spread being = 0.10%.
- UERg is above zero, +6.62%, as shown in green on the graph.
- The 19-week rate of change of the UER is 8.8%.
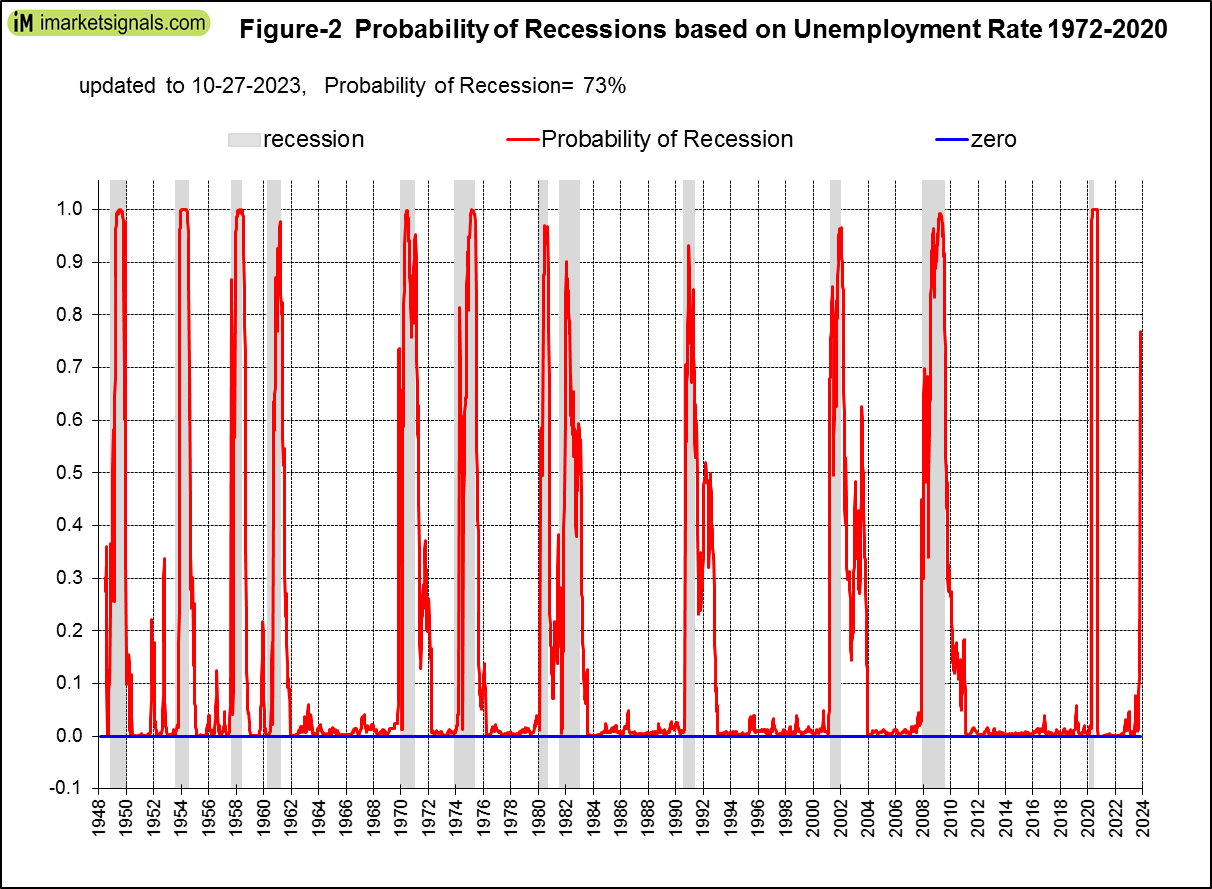
Recession Probability
Based on an assumed September 2023 unemployment rate of 4.0%, the probability of a recession would be 73%, as shown in Figure-2. The probability plot spans the period 1948 to 2020, encompassing twelve recessions.
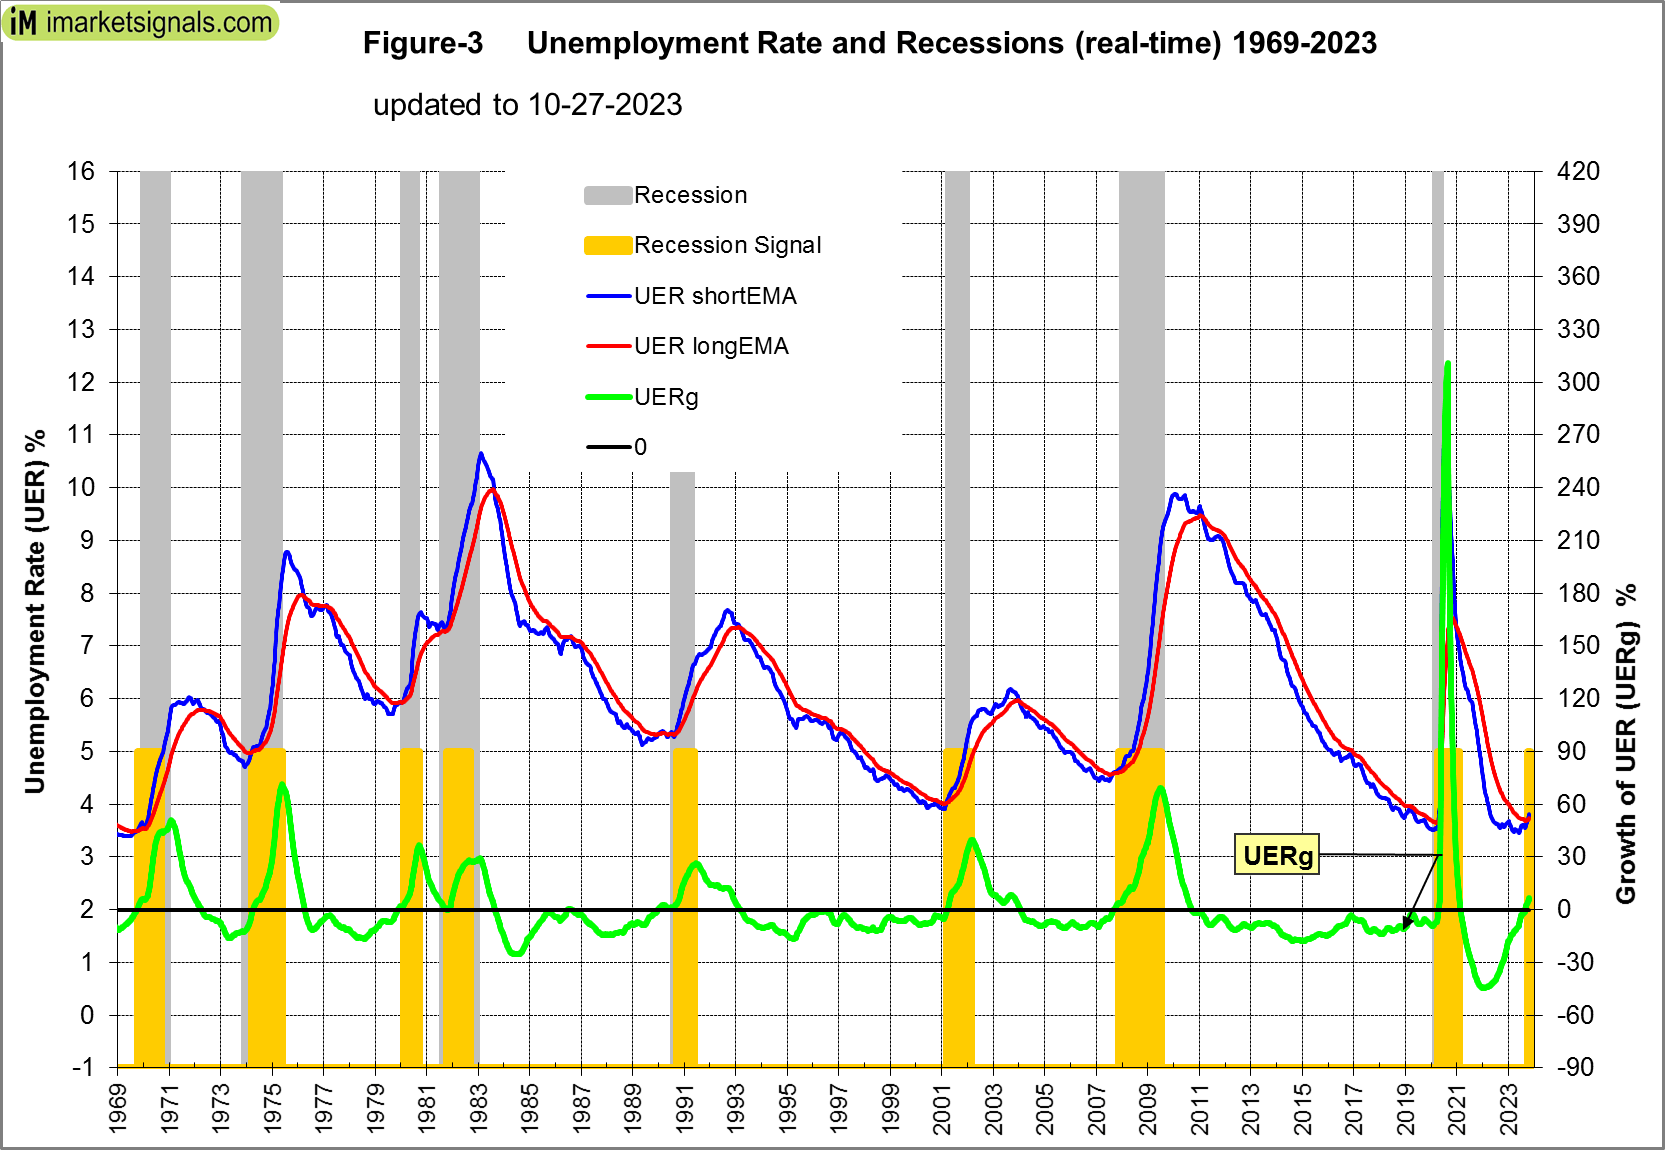
Historic Patterns of the Unemployment Rate Indicators Prior to Recessions
Monthly unemployment data is listed at FRED from 1948 onwards, a dataset that spans twelve recessions and covers a much longer period than the historical data for most other indicators. Figure-3 shows the period 1969 to 2023, with assumed UER data for September 2023. One can see that the patterns of the indicators are always similar before and after recessions.
Others have also observed this. For example, Gundlach, in a 2016 webcast, had been following a “new metric” – the U.S. unemployment rate versus its 12-month moving average; when the former moves above the latter it is indicative of an oncoming recession. For August 2023, the UER is 3.8%, and the 12-month moving average is 3.6%, thus supporting a recession call according to this metric already beginning September 2023.
Appendix
The model signals the start of a recession when any one of the following three conditions occurs:
- The short exponential moving average (EMA) of the unemployment rate (UER) rises and crosses the long EMA to the upside, and the difference between the two EMAs is at least 0.07.
- The unemployment rate growth rate (UERg) rises above zero, while the long EMA of the unemployment rate has a positive slope, and the difference between the long EMA at that time and the long EMA 10 weeks before is greater than 0.025.
- The 19-week rate of change of the UER is greater than 8.0%, while simultaneously the long EMA of the UER has a positive slope and the difference between the long EMA at the time and the long EMA 10 weeks earlier is greater than 0.015.
More By This Author:
Stocks Are Moderately Overvalued And 10-Year Forward Returns Look Reasonably Good
iM’s Business Cycle Index Recovers But Still Signals A Recession
Timing The Stock Market With The Conference Board Leading Economic Index


Comments
Log in or sign up to join the conversation.